

Bulls should have their eye on treasury bonds now
Bulls should have their eye on treasury bonds now
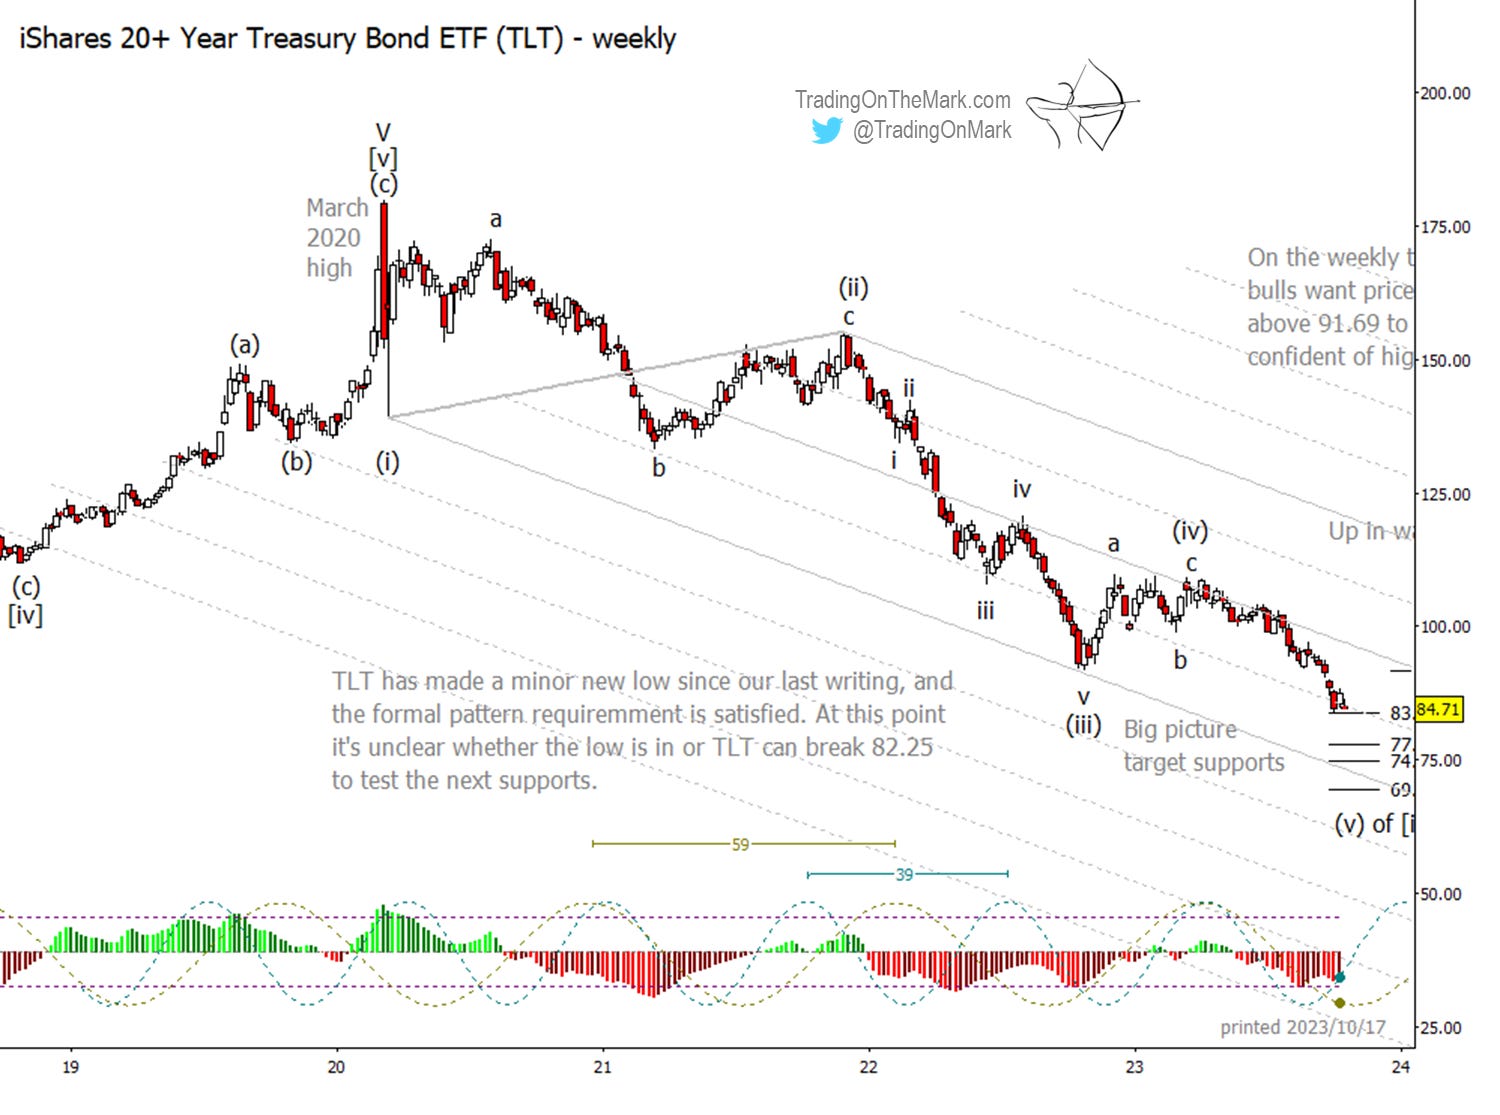
Following up on our August post about treasury bonds, the market has made a minor new low as expected. Now the pattern becomes more risky for bears, while bulls might have begun watching for an entry.
Did you know we follow intraday moves for the S&P 500 and related markets in real time during the day? If you’re an aspiring intraday trader, consider becoming a client of our Intraday Analysis service. Contact us at admin@tradingonthemark.com for details.
Looking again at the iShares 20+ Year Treasury Bond ETF (NASDAQ:TLT), we see that price is testing the Fibonacci-derived support zone at 83.95 to 82.25. It’s quite possible the pattern could extend lower, and there are additional big-picture supports at 77.84, 74.95 and the area from 69.60 to 69.18. However the formal requirements have been met for completion of the downward impulse that began in 2020.
On a slow trading time frame, bulls would like to see a weekly close above 91.69 in order to be reasonably confident the market can climb away from the low.
Zooming in with a daily chart, we believe the pattern down from wave (iv) has consisted of an impulse that just keeps extending. Is the final wave [V] of ‘v’ of (v) of [i] complete yet? The wave count can be interpreted either way.
If price continues extending downward, then the most relevant supports on a daily time frame mostly match the ones shown on the weekly chart above. There is additional minor support at 79.68.
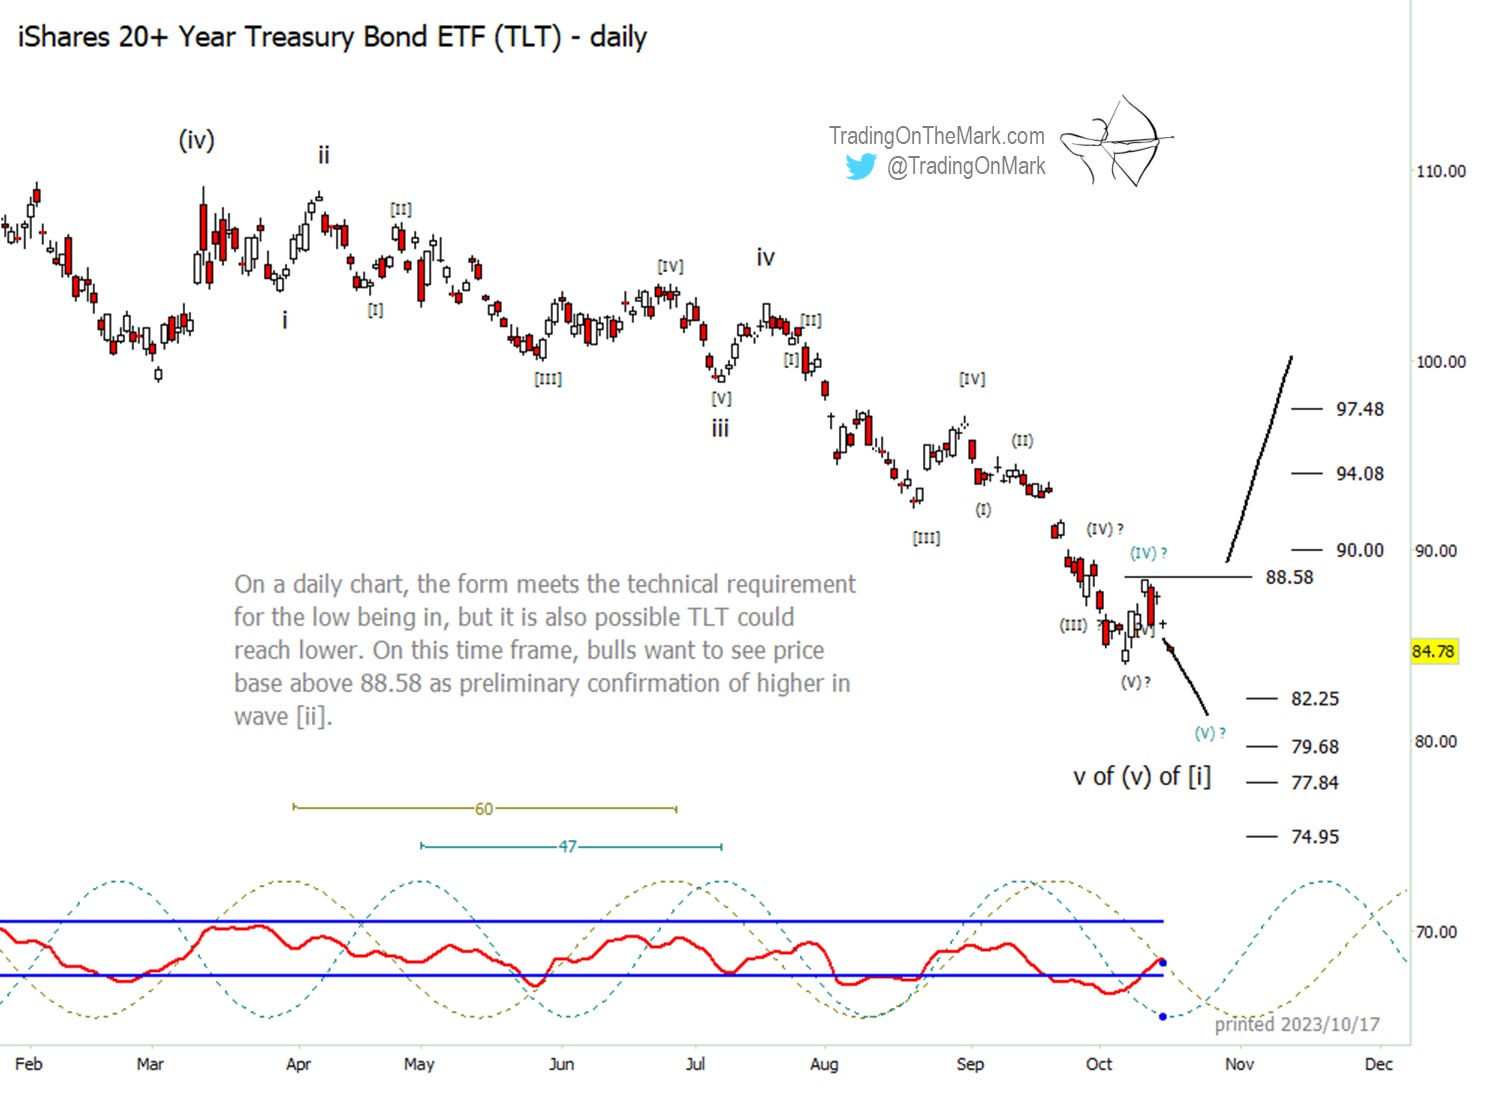
For traders working on a daily time frame or faster, a break and daily close above the Fibonacci-derived price level at 88.58 would lend initial confirmation to the bullish case. Cycles suggest that could happen somewhere between late October and mid-November.
We see stormy weather approaching. Subscribe to receive regular updates and catch the profitable moves that come with volatility!