


Crude oil looks bearish until the end of the year
Following the spectacular rise in crude oil prices in March, we have been monitoring subsequent price action in the context of a downward retracement. Here we take readers through the Elliott wave analysis on weekly, daily and intraday time frames to produce a forecast going into the end of the year. We also provide an update to last week's article about the S&P 500 Index.
Provisionally we are treating the climb from the 2020 Covid low as wave [i] in what we expect will become a substantially larger upward pattern in coming years. However in the nearer term the charts show what we believe is downward wave [ii] that is retracing part of the advance.
A second wave typically has three parts, and on the weekly chart we have labelled what we believe are sub-waves (a) and (b), with price now working on downward (c). As we have mentioned elsewhere, a C wave should consist of five parts, and we have drawn a speculative five-part path downward through the macro supports that can be calculated based on weekly bars. The first confirmation of a bearish path on this time frame would be a break and weekly close beneath 84.20, with a break of 74.80 providing additional encouragement for bears.
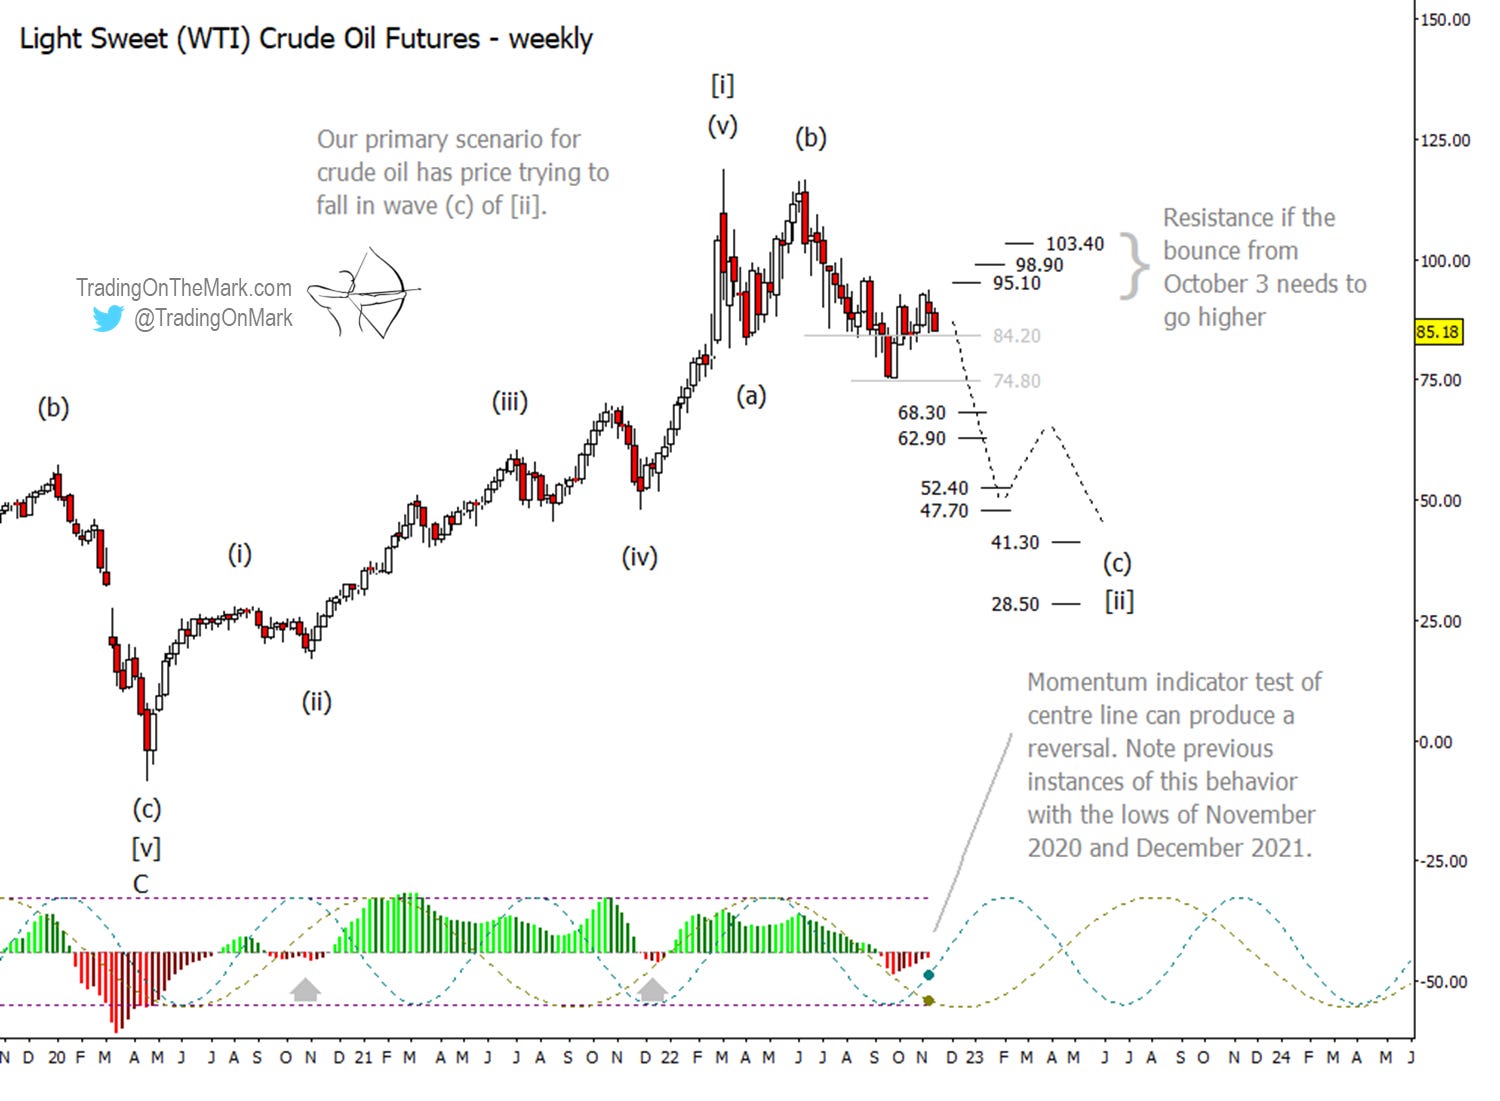
Also note on the weekly chart how our preferred momentum indicator, the adaptive commodity channel index (abbreviated as CCI) has made a habit of testing its centre line at times when price action reverses. This doesn't always happen, but it's useful enough as a trading tool that we monitor it on all time frames.
In case the expected downward reversal fails to take hold near the current area, we have marked additional resistance levels to watch.
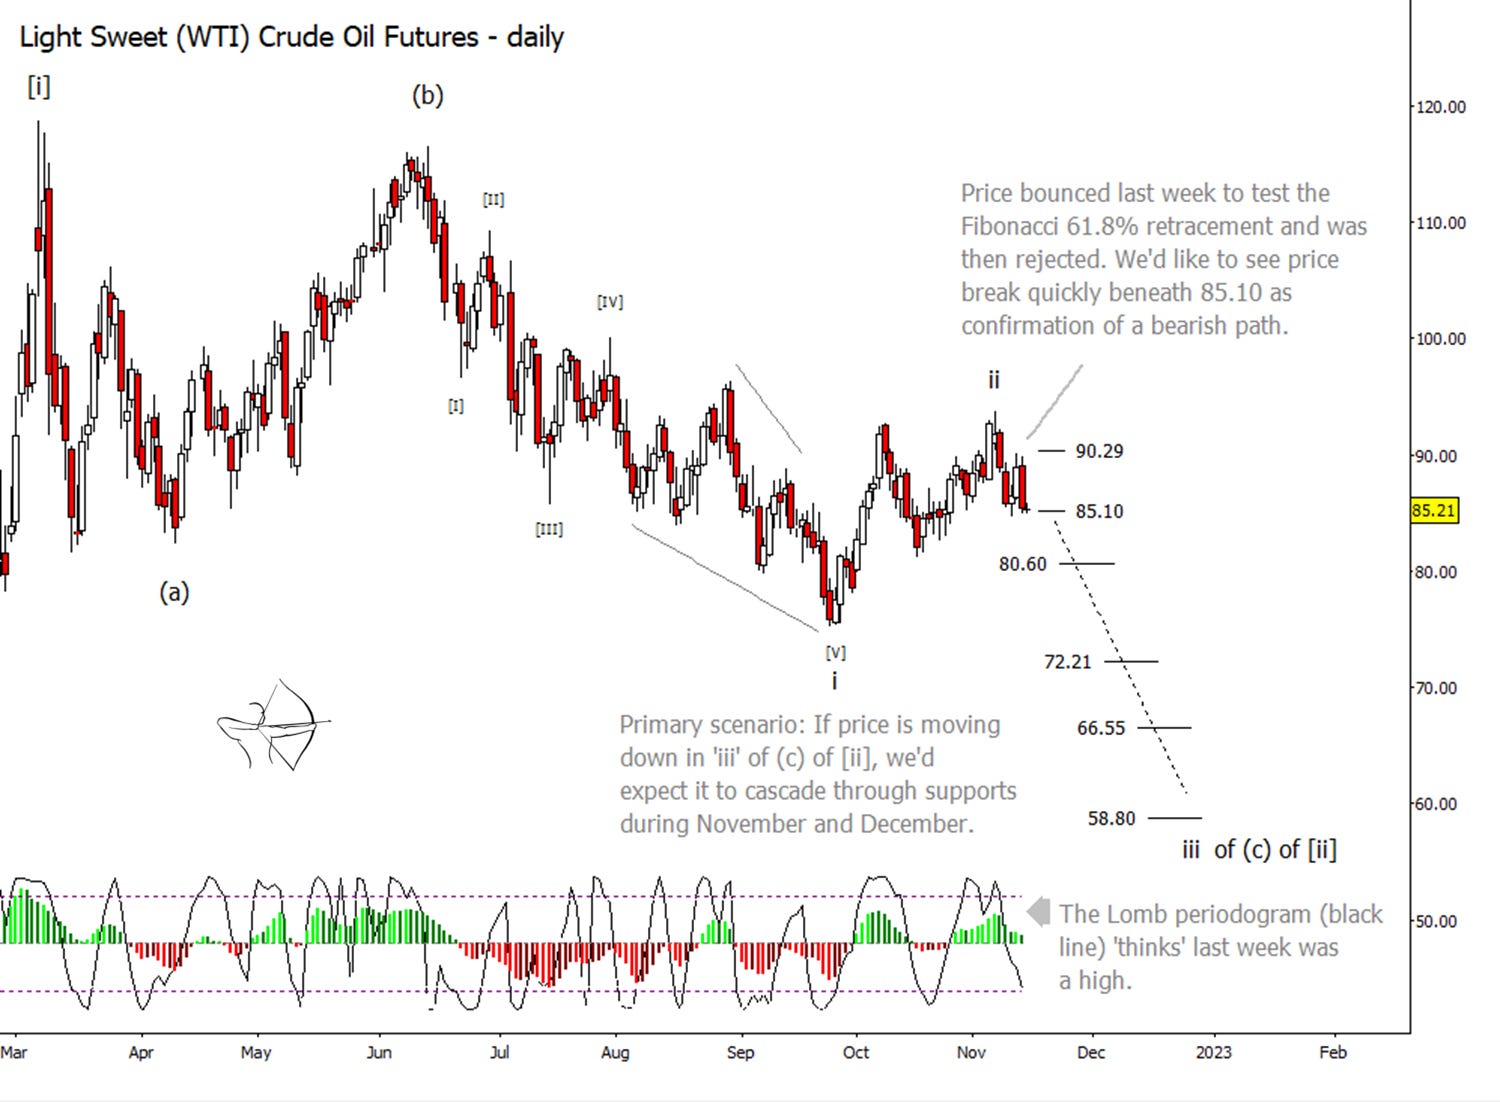
Traders who work on a daily time frame might wish to seek trades in the context of the downward i-ii-iii-iv-v structure that should comprise wave (c). We have drawn part of the expected path on the daily chart below. On this scale the first confirmation of the downward break would be a failure of support at 85.10 which held on the previous tests last week and on Monday. Note that price closed on Monday near the day's low, which is a bearish sign.
If price starts to slide, then 80.69 will probably represent a minor speed bump on the way down. More important daily supports wait at 72.21, 66.55 and 58.80. As price moves through those areas there might be opportunities for the pattern to extend and accelerate, but the initial conservative expectation would be for downward wave 'iii' to consist of five simple waves that would be visible on daily and intraday time frames.
Overlayed atop the momentum indicator on the daily chart we have included another of our favourite trading tools – the Lomb periodogram. Its algorithm attempts to discern the market's current phase in terms of an assumed price/time cycle. Last week the Lomb signalled that price was probably making a cyclical high.
Whenever we suspect a retrace is happening, either upward or downward, our first analytic step is to compare price movement to a set of ideal retracement values. One such set of values includes the Fibonacci ratios shown with the red lines on the intraday chart below. (A 50% retracement is not really a Fibonacci ratio, but we include it here because sometimes the market notices it too.) Crude oil bears who traded on an intraday basis off the 61.8% retracement area had a good day on Monday.
A similar set of ratios comes into play when we are comparing the sizes of waves going in the same direction. For example, a third wave and fifth wave in a five-wave sequence often have Fibonacci relationships to the distance price travelled in the preceding first wave. Our extension tool produced the supports shown in blue on the intraday chart, based on the size of wave [I] and measured from the top of wave [II].
One of the three inflexible rules of the Elliott wave methodology is that a third wave in a five-wave sequence must not be the shortest among waves one, three and five. That rule helps us assign probabilities to the targets shown below for wave [III]. For example, while price could find brief support at 84.51, it still would have travelled only 61.8% of the distance of wave [I]. Lower supports at 81.06, 78.60, and 75.47 are more attractive as targets for a wave [III].

Earlier we showed how the CCI on a weekly time frame can produce a test of the centre line when a reversal is more likely. The CCI on the intraday crude oil chart shows even more examples of the same behaviour, as marked with the grey arrows. Not every momentum indicator has this tendency, but each type has its own advantages. If the CCI is not available in your charting platform, we recommend experimenting with other momentum indicators and studying how they behave particularly around price reversals.