


Downward paths likely for crude oil and gold
Crude oil and gold markets have been choppy in recent weeks, but we're watching for signs that downward trends can resume with both commodities.
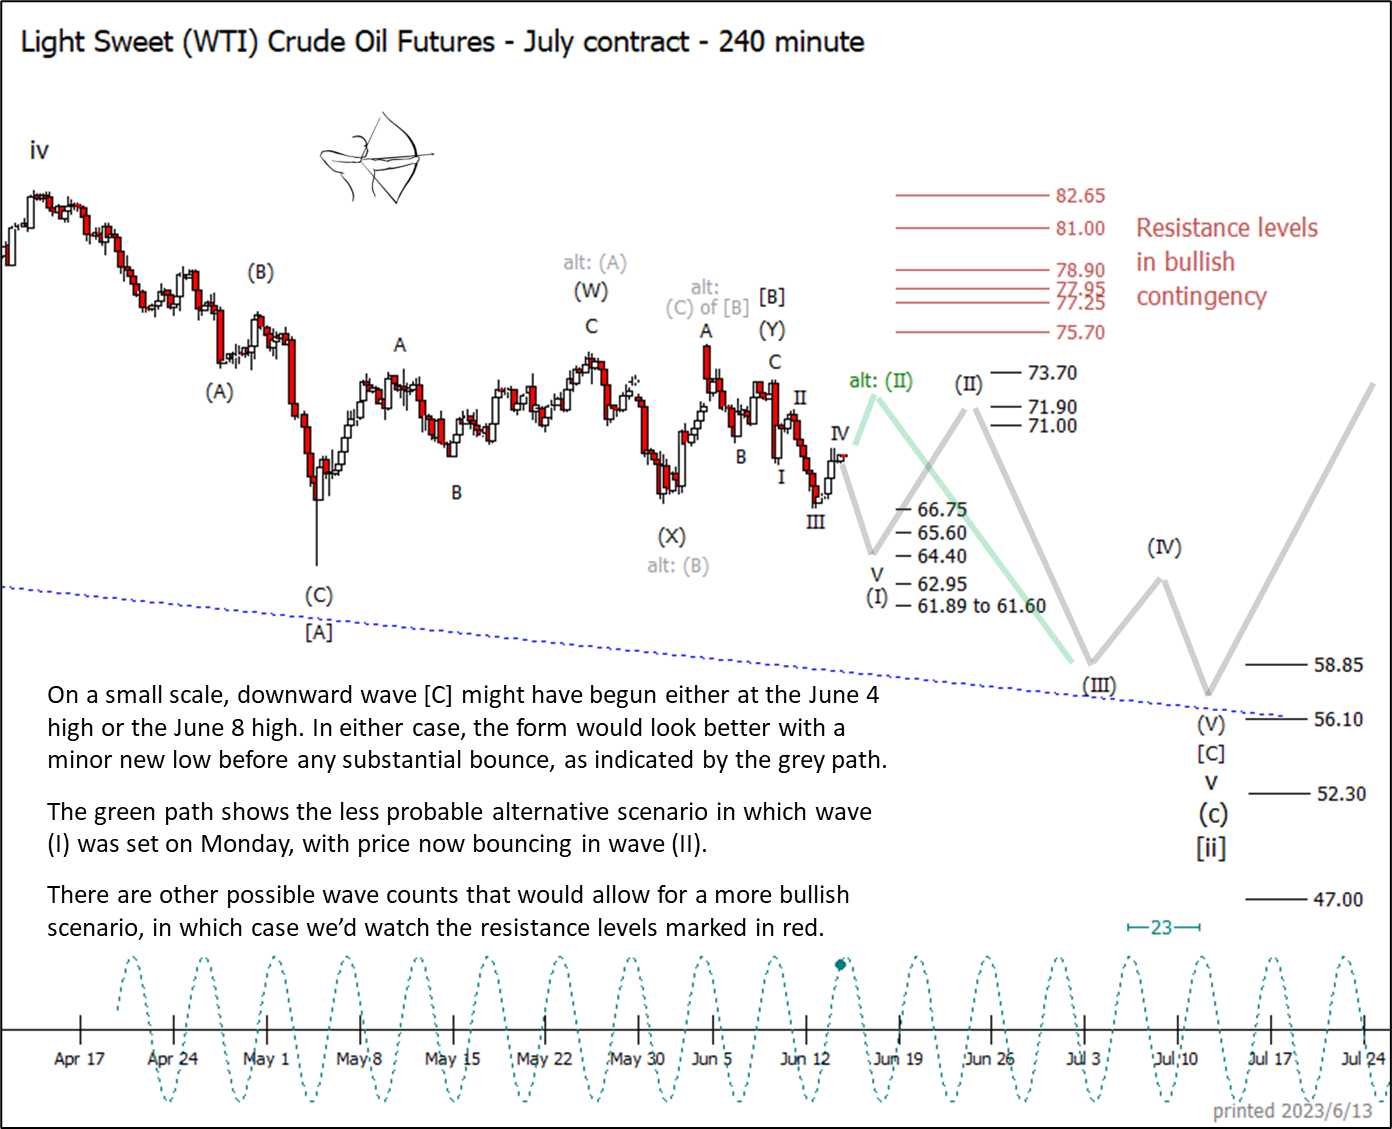
The near-term bearish case is strongest for crude oil, as depicted by the grey path on the chart below. The pattern down from the high of wave [B] would look better with a new low for wave (I) seated among the supports indicated between 66.75 and 61.60. (Note, this is true for both the primary and the alternative placement of wave [B] on the chart.)
The alternative path shown in green reflects the possibility that wave (I) might already be complete, with price currently bouncing in wave (II). If price follows the green path this week it would leave the decline from early June looking more corrective than impulsive. That would increase the probability that the rest of the decline will follow an "ending diagonal" pattern into the low of wave [ii] instead of an impulsive pattern, and it would make it more difficult for price ever to reach the lowest supports shown on the chart.
Gold prices have been staying mostly within a channel since early May, and we view the recent test of the upper channel boundary as a probable fourth wave of a downward impulse. The easiest path this week and next week will probably be downward to test supports near 1,921, 1,910 and possibly lower.
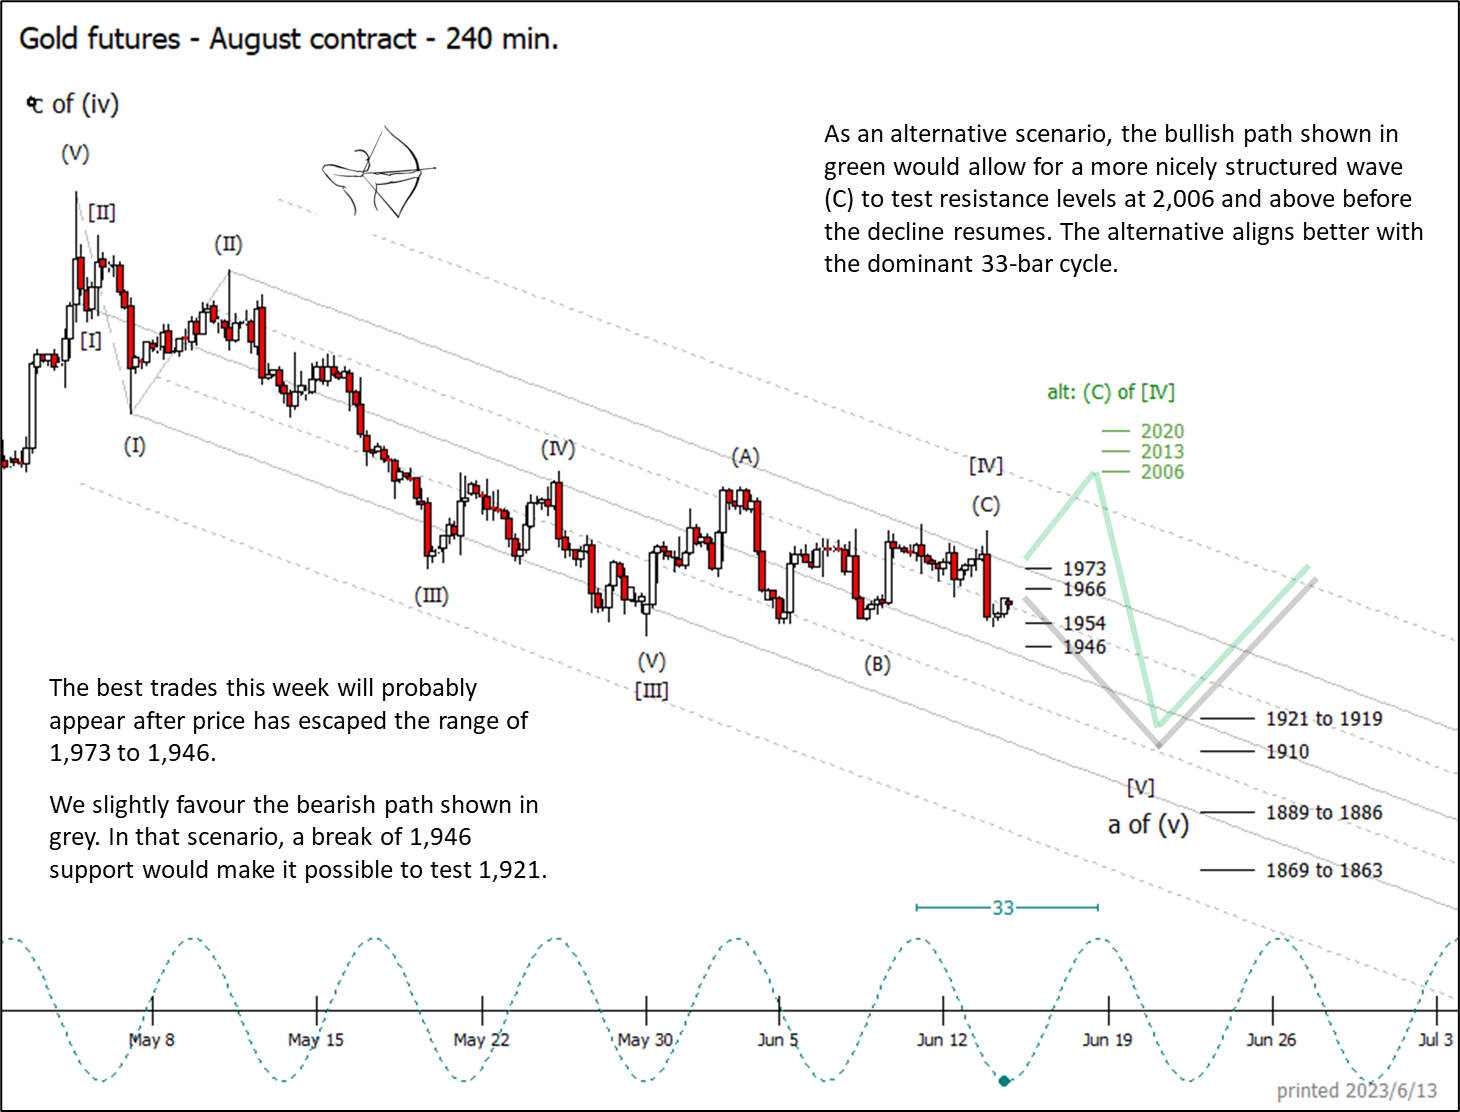
The near-term bullish alternative path drawn in green would allow for a cleaner impulsive sub-wave (C) to finish wave [IV] of the decline. In that event, we would watch the resistance levels from 2,006 to 2,020 to cap the move.
Trading On The Mark uses technical analysis to identify the trends and turns in highly traded markets for commodities, energy, currency, bonds and indices. Consider subscribing to our daily or intraday services!