


First Look: 2022-09-02
So far, the market is treating the econ news this morning as being in the Goldilocks zone, neither too hot nor too cold, and rising. As to form, I like treating the low from yesterday as a ‘b’ wave type low, but that interpretation is not without problems as it is deeper than what would be expected for a ‘b’ wave. I’ve added an alternate in blue that deals with that which would allow a retrace up over the 4010.50 to 4022.25 zone to test 4054.75.
Correction: 4063.00 should be 3863.00 on the following chart.

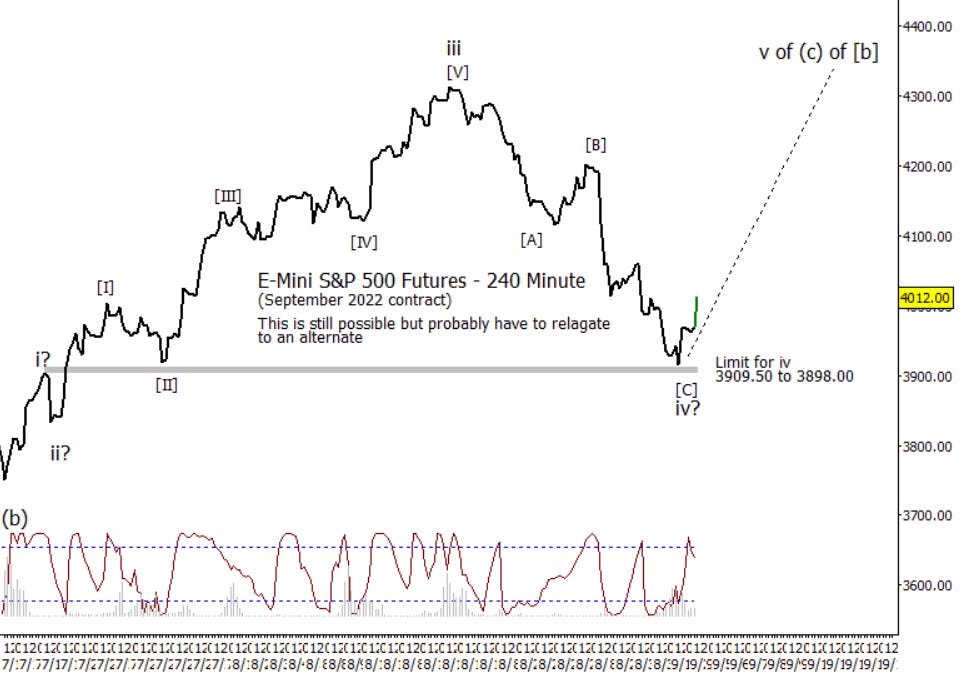
the limit yesterday. This treats the drop into yesterday as a deep wave iv and would
Here is a chart that I have been keeping an eye on for a bullish alternate that reachedallow a retest of the August high. This was my preferred count until last week. If you think the big boys buy when they come back from vacation next week, this is the chart for you.
Nice alternate chart. Any LD possible to upward ? (just a thought) Thanks