


Midday Update: 2023-01-12
Today has been a roller coaster ride in futures ahead of the day session open and even a bit after with a fast dip just post 13:00 on an attempt to sell a lower high. I can’t make myself be bullish but important to have some proof of a reversal that is so far lacking.

And the futures chart on a 240-minute time frame.

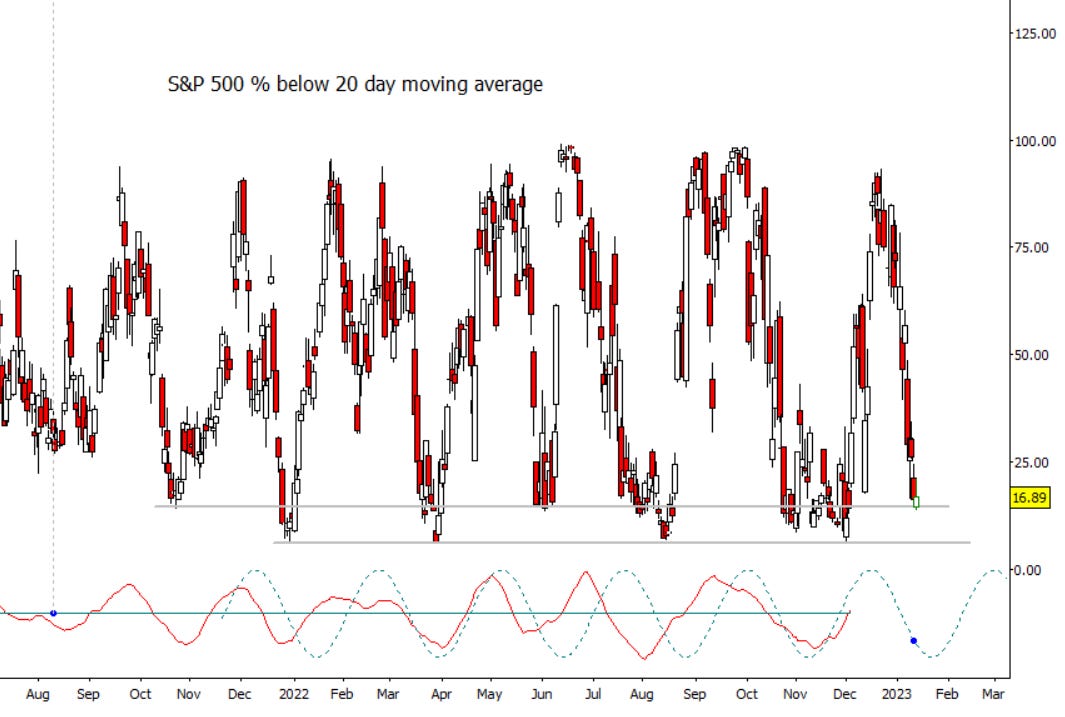
And another chart that I have an eye on, the percentage of stock in the S&P 500 below the 20 day moving average. Down at the top of the extreme zone. That doesn’t mean it can’t get more extreme, but I think bulls are a little too optimistic from here.
I have a question (except if it is a secret sauce) to get a better understanding of your charts/Analysis
Of course, when you have time
What represents the blue line (or line) at bottom of your charts ? Any cycles ?
Thanks again for Bonus (Midday)