Midday Update: 2023-03-20
Equity rally on CS sale
Before moving on to the S&P 500, let us look first at crude oil as it is the chart I have been looking at. CL bounced just above a possible wave [III] target of 64.20 this morning. Is wave [III] now complete? Maybe but I wouldn’t rule out a smaller fourth and a new low around 62.80 or 61.30 while under 67.60. Another option is the bounce late last week may have only been a lower degree fourth and I need to shift the labels a swing to the right which would make this the wave (IV) bounce. Net, bears should manage but might be too early to play for much of a bounce.

Ok, on to the S&P 500. S&P 500 futures tested a wave [B] support in the early morning and have been rising steadily since. This is consistent with the idea that there is more work to do in the formation of wave ii. Here is the futures chart I mentioned for reference.

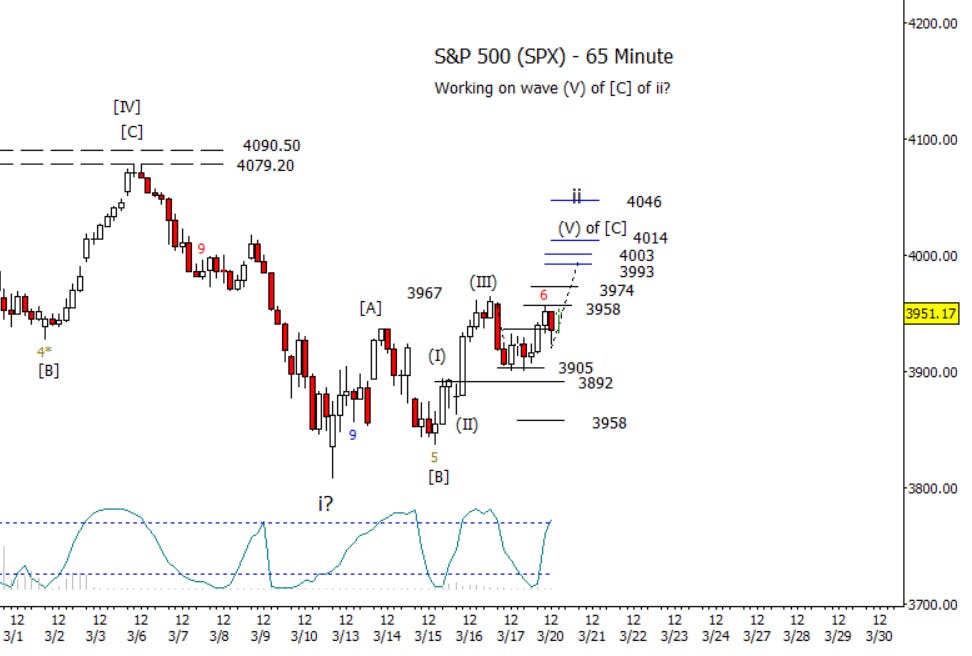
In cash, I’m not sure about calling the drop a [B] wave as it could still be considered a (IV) in the development of [C] of ii. Ideally there is one more swing high above the current resistance at 3958 to complete (V) of [C] of ii. These targets are based on wave (V) to (I) relationships. The sleeper alternative is a truncated high against 3958.