


Midday Update: 2023-04-21
S&P 500 flirting with a breakdown this morning
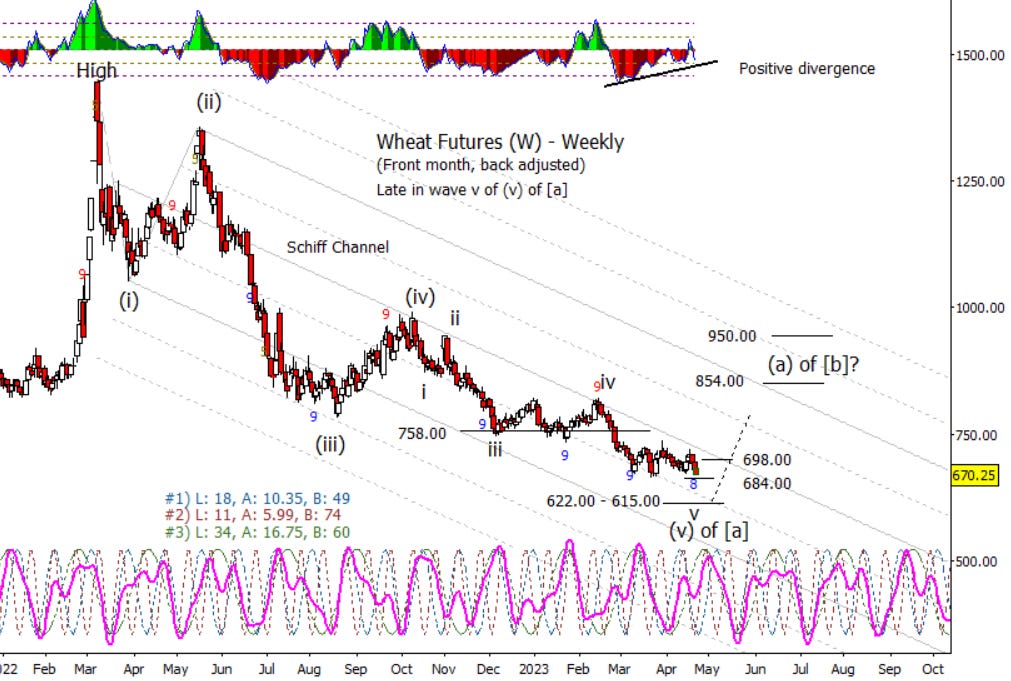
I have been asked for an opinion on wheat and natural gas. Let us start with wheat.
When I last posted a wheat chart it was trading around the (v)=0.618(i) extension around 758.00. It attempted to bounce a few times off of that but dropped under in late February. The next extensions I’m watching are 684.00 and 622.00 based off of internal waves since the bounce from last October and the (v)=(i) at 615.00. If 684.00 proves to trigger a bounce, over 698.00 would be first confirmation of a reversal.
No low seems low enough in natural gas but I can’t see being bearish down here against 2.09. If NG can recover 2.48 and 2.72, I favor up into the autumn to at least retest the shelf from 2020-21, say around 4.58 if not a spike into 6.28. As to form, it still looks like it is very late in pushing down from a (b) wave high set in August of last year.

I’m going to show this chart of S&P 500 futures instead of SPX as I think it has the better looking chart. Notice how it is attempting to hold above the floating parallel in red which could be a wave (IV) in an ending diagonal (V) of [V] of c of (ii). Yes, bears took a couple of swings to break support early and there is a non-ideal low in the Nasdaq 100 futures that futures, but the longer this area holds and creeps up, the better the odds become that bears will be forced to cover and allow for a push to 4167.00 and more.
