Midday Update: 2023-10-13
Equity indices down, crude up.
Starting with some interesting geometry in the 130-minute chart of SPX. I’ve added a modified Schiff channel to this chart anchored on the late July high, August 18th low, and September 1st high. Interesting that the high for the week was against the median of the channel. My primary hypothesis is that we see the S&P 500 down into later this month.

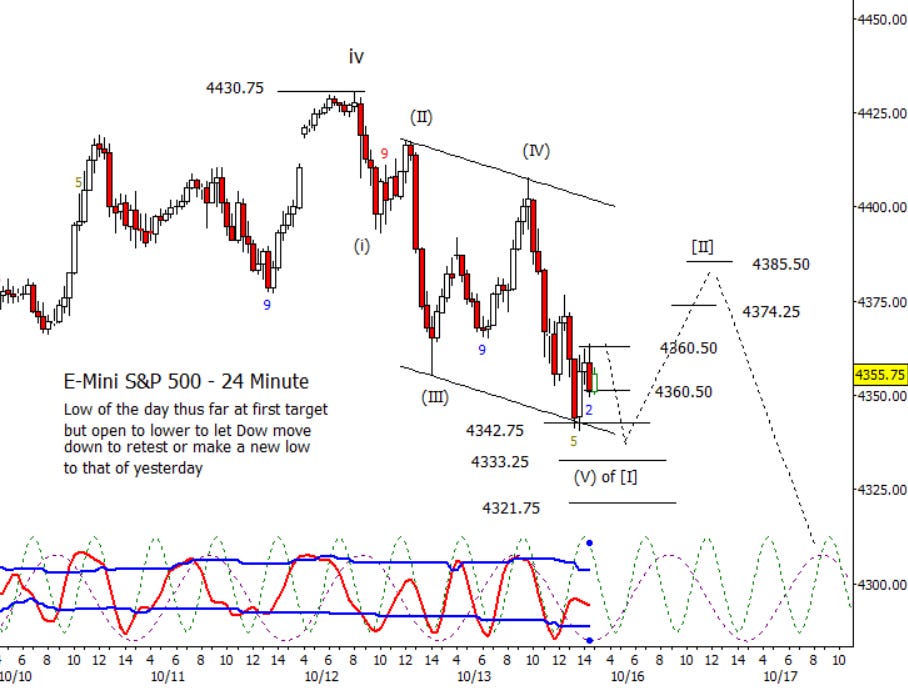
Dropping down to a lower time frame and using futures, we see that we did get a new low under that of yesterday though the path was a little different than I expected. The bounce early this morning was more than I expected. Is the wave [I] low now set? There was a decent bounce from the initial target zone and a floating parallel, but it troubles me that the Dow hasn’t made a retest or new low to that of yesterday. I’m inclined to watch the rest of the day and probably early on Monday to see if the pattern clears up.
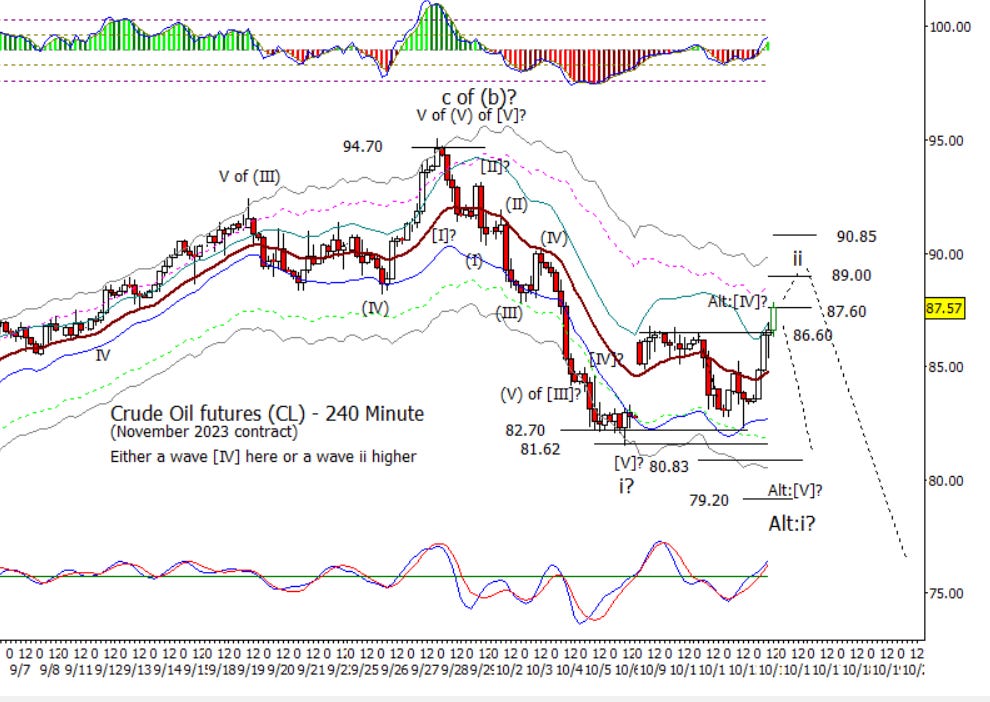
Crude is advancing again which is putting pressure on the wave [IV] idea and strengthening the case for a wave ii bounce. Next step up past 87.60 is 89.00.