

Stock indices can forge a bullish path into year's end
Stock indices can forge a bullish path into year's end
For our newsletter readers, we wanted to give you an update on one of the equity indices going into year’s end. Here we use charts of the S&P 500 Index on various time frames to show some likely scenarios and areas to watch.
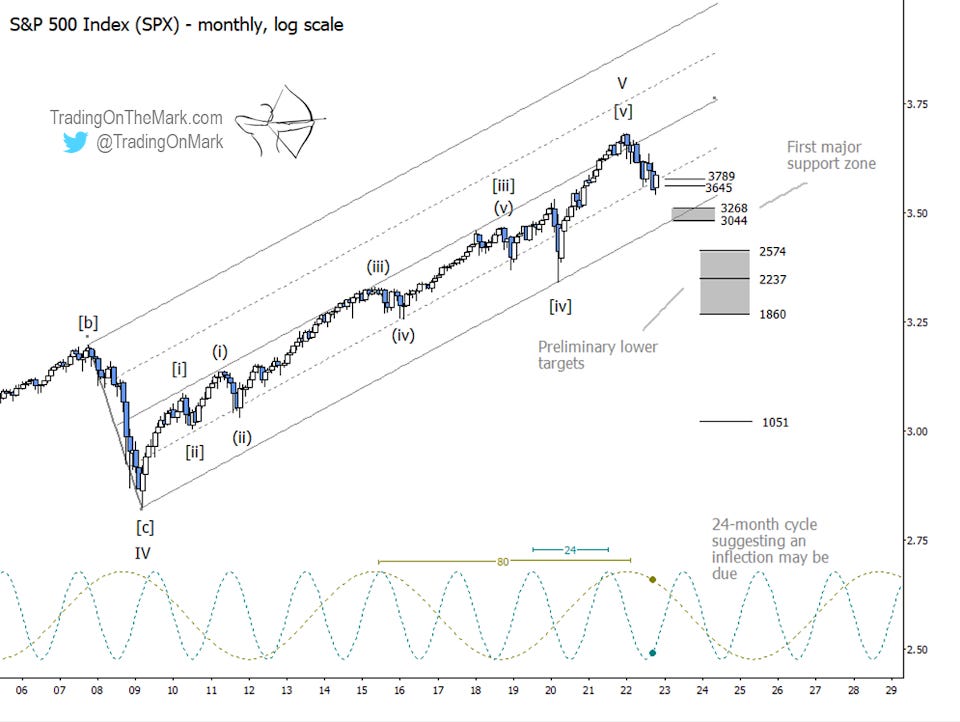
For context, the monthly chart below shows our main scenario in which the market made a durable high at the start of 2022. Ideally we would like to see a test of the area near 3268 and 3044 before we consider that the corrective pattern might be complete, but in the near term we expect a bounce from the current area.
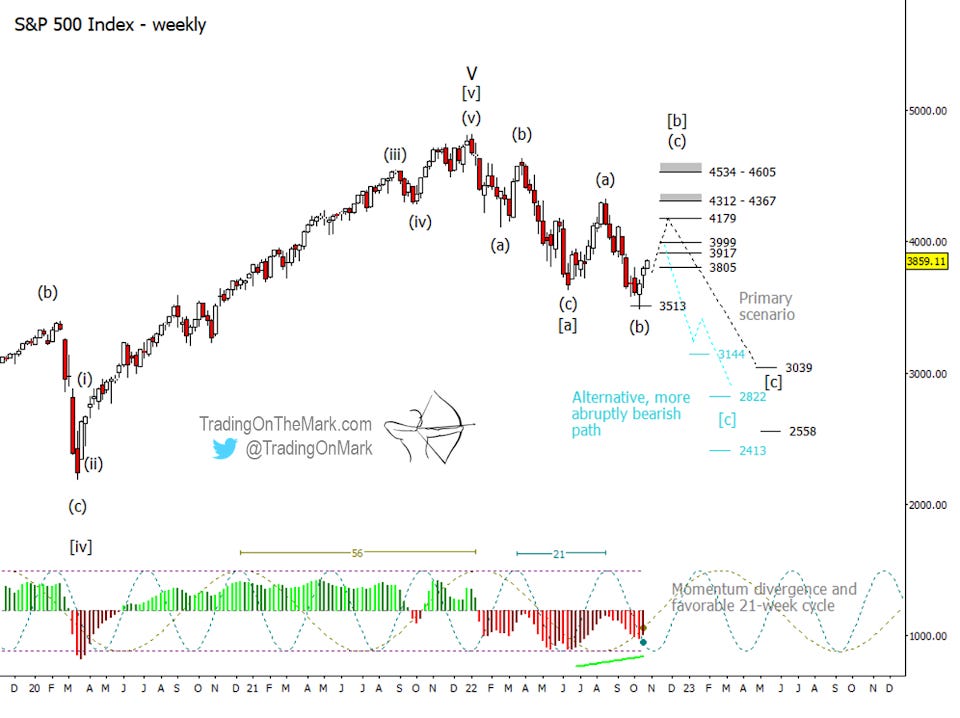
On the weekly chart we have drawn two competing scenarios. Both of them are bullish in the near term, and we believe the bounce started last week.
If the index can rise above approximately 3999, that would increase our confidence in the primary scenario and would make targets viable at 4179, the zone between 4312 and 4367, and the zone between 4534 and 4605.
Alternatively, a test and retreat from one of the lower resistance areas at 3805, 3917 or 3999 would make possible a re-test of the 3513 support. If that area were to fail, we could see the index cascade into the areas near 3144, 2822, and 2413.
Note that our favorite momentum indicator is showing positive divergence on the recent low, forecasting a bounce or consolidation. The 21-week cycle is also consistent with a low here.
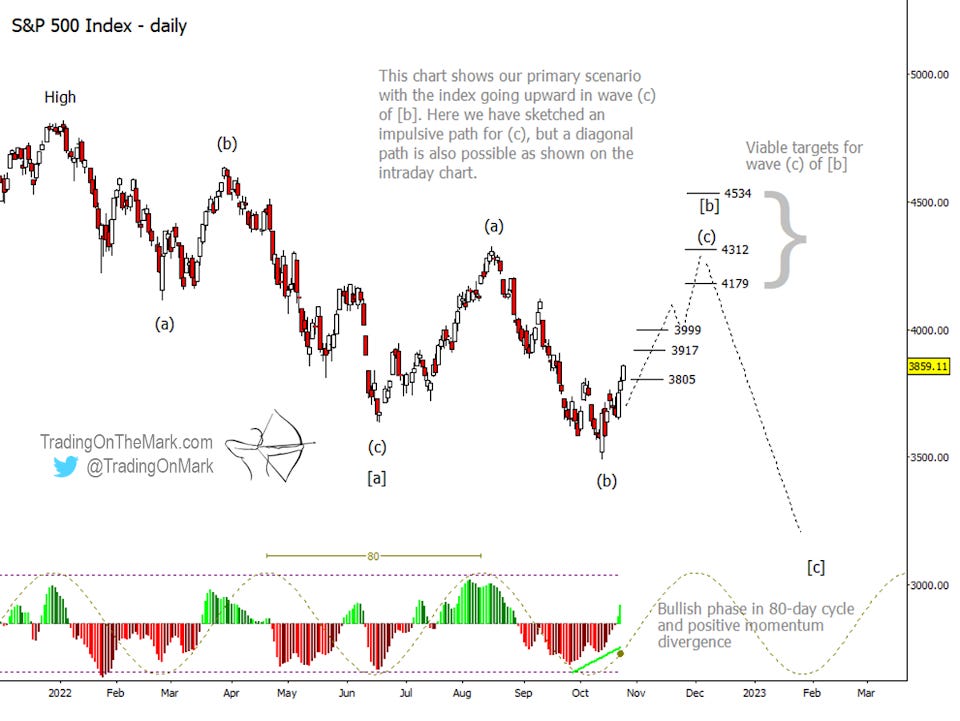
If the index is currently climbing in wave (c) of [b], as shown in our primary scenario, then wave (c) should consist of five sub-waves. On the daily chart below, we have sketched a path for wave (c) that is impulsive – i.e. does not have overlap between the first and fourth sub-waves.
Typically, Elliott wave traders do best when they try to catch third waves and "C" waves. The path drawn on the daily chart shows a typical form for a "C" wave, with the middle 3rd wave being strongest.
On daily and faster charts, you may see price break above any of the resistance levels shown here and subsequently find support at the same levels.
Although the daily chart shows wave (c) taking an impulsive form with a strong middle wave, we're a bit more partial to the idea of wave (c) forming an overlapping diagonal pattern as illustrated on the intraday chart below. This time-consuming pattern would allow the market to produce the typical end-of-year rally while still treating the rally as a bear-market bounce.
On the intraday chart we have marked some important dates for U.S. economic announcements on November 2 and 10 and December 14. Please keep in mind that this path is quite speculative. We'll be able to improve and fine-tune the forecast as more price data comes in, and we might end up rejecting the diagonal idea if structure begins to favor one of the other scenarios.
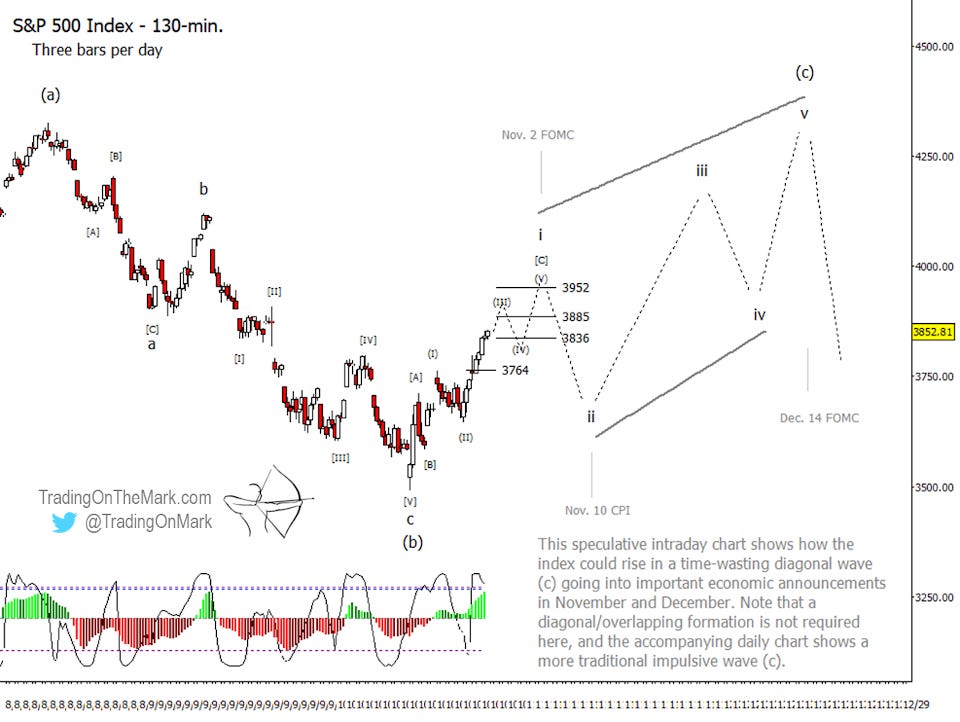
In the near term, we expect 3764 to act as support if tested this week, and we would like to see price climb up the ladder rungs at 3836, 3885 and possibly 3952. The size and structure of completed wave 'i' will help us better forecast the rest of what we expect to be a five-wave move going into the end of the year.