


The Day Ahead: PM Edition 2022-09-12
Now waiting for the CPI in the morning
Bonds
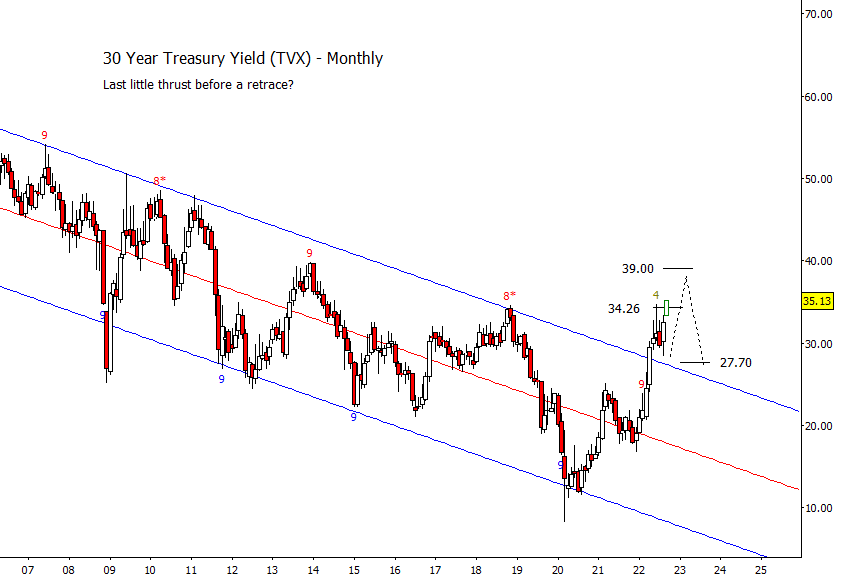
Before looking at the daily bond chart, how about this monthly 30 year yield chart. Should be in the last thrust prior to a retrace. I would think there is a retest of the breakout above the channel.
ZB traded sideways today staying in the range of the last few days. I’m penciling this in as a wave (IV) though I don’t know …
Keep reading with a 7-day free trial
Subscribe to Trading On The Mark to keep reading this post and get 7 days of free access to the full post archives.