


The Day Ahead: PM Edition 2022-10-13
Bust and boom
Equity Indices
I’m going to include some other charts here so not exclusively the SPX today. What a day. The day starts off with an overnight recovery prior to the CPI number. CPI comes in hot and futures tank hard to just above the first support level in S&P 500 futures right at the open (the same level in YM was hit). I’m not surprised that a bounce started there. What I didn’t expect was the flurry of buying that built afterwards when it became evident that bears lost their nerve and covered. As I commented in chat today, the way to score today is if you didn’t get hurt, you are a winner. After writing the morning update, I started poking around through charts thinking about what is happening.
Here is an Apple chart that I have been watching. What I find interesting about it is the cycle has been pretty regular and now at a low while it has held above the June low. Clearly the trap door didn’t open today and if the cycle remains in force, should turn price up into late November.

Microsoft is weaker and might argue that the decline down from the August high could be a five, there is enough ambiguity and this low is well within bounds for a (b) wave low. Another thought that I have been toying with sparked by a comment by Kurt is that perhaps I’m counting this too quickly, hence why I labeled the August high (a) of [b] instead of all of [b]. It matters less about next direction and more about what forms should manifest from here. In the case of a (b) wave low here, a five up would be expected to finish (c) of [b]. In this case the cycle is scheduled to turn up into to the second week of November.

Now how about a weekly chart of the Russell 2000 futures. R2K walked across the trap door of the June lows but failed to break. Yes, plenty of positive divergence here and in other indices, but I didn’t want to lean on that saving itself. Yes, it worked this time but I’ve relied too much on divergence in the past only to get run over. Now I look for some evidence of reversal but I digress. Next cycle inflection here is mid-November but the cycle composite is up into the end of the year. I think up into November is what to look for now, we’ll see about December later.

Now a look at the NYSE composite daily chart. One of the things that I have been thinking about is the form down from the August high. To me, it looks more like seven swings, a corrective move, instead of a five for an impulsive move. I also like how this interpretation measures out and it is an extension value that I came up with 13295 for a target. I also have added a retrace tool to show how a typical ‘b’ wave retrace value, the 1.382, held.

Now back to the S&P 500. Over 3680 tomorrow invites a press for at least 3731 and a try at filling the gap at 3744. The first major resist for (c) is at 3918 and might be hit in a week or two.

Bonds
Bonds made a new swing low just above the next support at 122^24 and bounced. Form could be complete on this new low. It has been quite a run for bond bears but I think they need to be aggressive in lowering stops. Over 125^23 increases the chances that the wave [i] is set. Is it too early to talk about a low in bonds prior to the November and December FOMC meetings? I don’t think so, it only means that the market has already factored in expectations for rate hikes for the rest of the year. I also wouldn’t be surprised at a higher low forming early next month to coincide with the next FOMC meeting.

Crude Oil
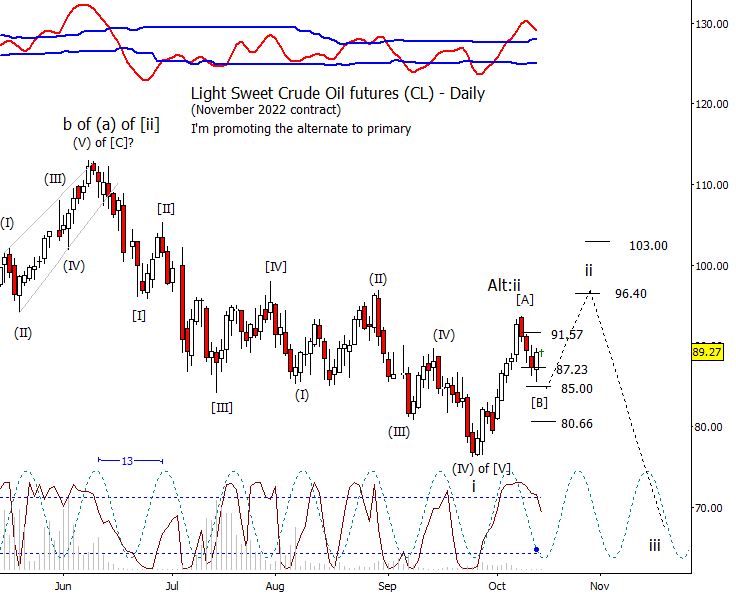
I’m promoting the alternate to primary as if equities are headed for a decent bounce, crude probably bounces as well. That means we probably have higher to go in wave ii over the next couple of weeks.
Dollar Index
DX was down today but it isn’t a serious problem yet for higher to complete wave [iii]. I’ll become concerned if DX drops under 111.37 as then the odds of entering a wave [IV] retrace go up.

Euro
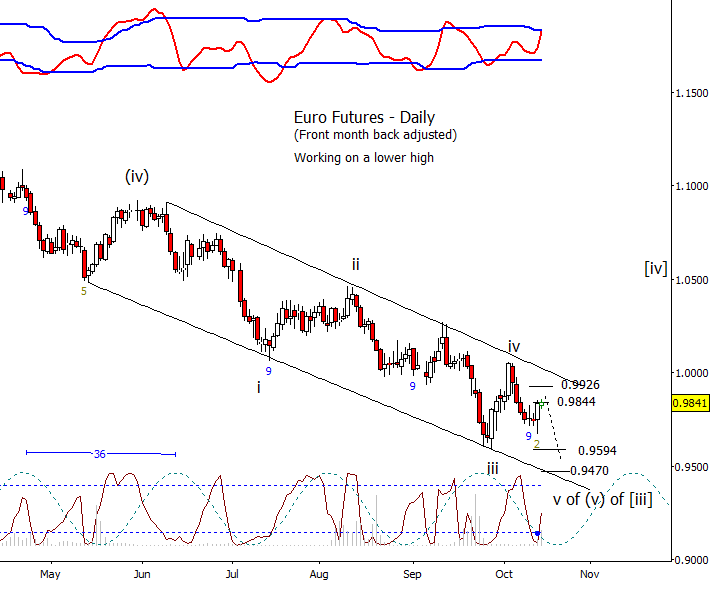
Euro moved up today but now has the RSI, the study at the top of the chart, now in overbought territory against initial resistance at 0.9844. I would like Euro to eventually at least retest the September low before looking for a larger retrace up to form.
Gold
Like many things today, gold started lower then recovered. I’m assuming that GC is now working on a low degree wave two for a lower high. Initial resist at 1682.50 and the moving averages just above that, but thinking it finds a way to the deep retrace values of 1704.40 and 1716.25.
