


The Day Ahead: PM Edition 2023-07-13
The US equity markets grind higher. New all time highs will arrive soon, right?
Ok, I’m going to depart from my normal format a little as I’ve been thinking about what is going on. I’m starting to see more writing about new all time highs should be expected this year. I’m still skeptical.
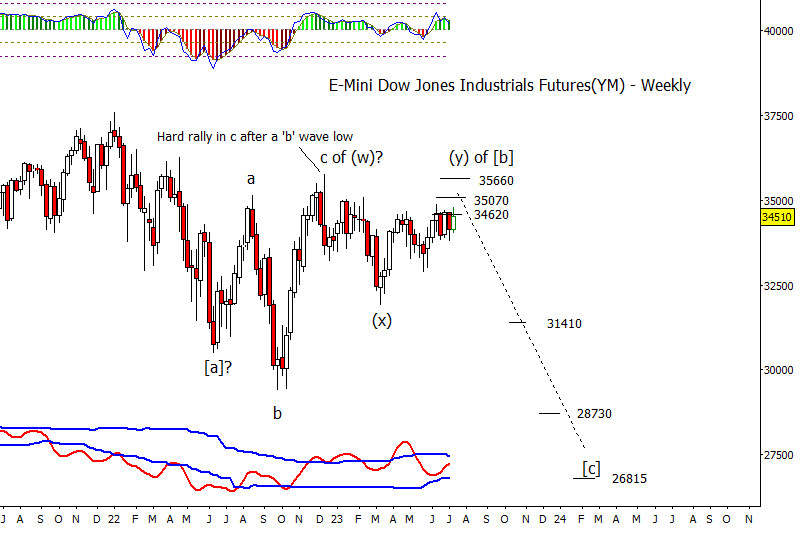
I’ve been staring at a Dow futures chart and it doesn't look that healthy to me. On the chart below, notice the vigor that YM had out of the low from October of last year. In just two and a half months, it recovered 75% of the drop from the high. That kind of move is something that you would expect to see from a ‘c’ or third wave, in this case a ‘c’ wave fits as the low has the look of a ‘b’, being made of three segments down from the August high, labeled ‘a’ on the chart. The overall pattern from the June 2022 low to the December 2022 high has a 3-3-5 look for a correction. Ok, what after that? A probably three wave decline that retraced about half of the advance. A bull at this point is thinking that there was a clear impulse up from the October low, a three-wave decline, next should be a powerful third wave up. Well, the move up from the March low has been anything but powerful, more like anemic. In total, YM had done nothing for seven months, not how a bull market should react. How hard can it be to move 30 stocks? Am I to believe that in a bull market, such a narrow index with 30 components can’t get out of its own way?
No, I think everything since June of last year is a complex corrective structure that could complete here against 34620, which has held Dow futures for about a month now, or slightly higher. I suppose a bull will say that this is just coiling ahead of an explosion upward. We will see.
Let us now look at the Russell 2000. At least it managed to push over resist at 1296 this week but keep in mind that it is still in a range that has lasted for a year. So best thing you can say is that it is making a push for the upper end of the range. Given that fading the range has been working for a year, I expect bears will give it a go again before long.

Not necessarily a fine-grained tool, but the percentage of S&P 500 components under the 20 day moving average is pushing toward the extremes seen over the last couple years. I think SPX is due for a pullback at a minimum fairly soon. Note that while SPX made a new swing high today, we see a higher low in this chart.

S&P 500
While I can’t swear that I have the micro count nailed down, I think it close. I think there is a case can be made for five waves up from the July 10th low. Sure, it can extend but there is negative divergence against momentum on the 65-minute chart and also divergence with the CCI on the daily chart. For bears to be able to feel good about a reversal, they need SPX under 4470.


Bonds
ZB pressed up past the .382 measured from the wave ii high to the .382 retrace at 127^07 measured by the wave (iv) high in early April. I’d like a retrace down from this area for wave [b] of iv.


Crude Oil
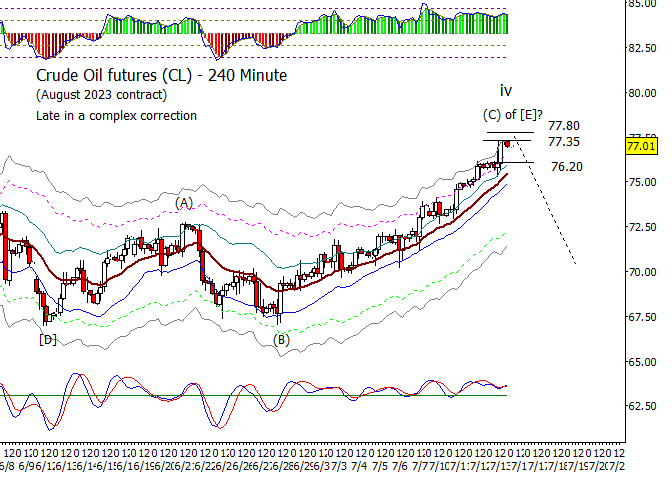
Crude extended higher today popping over the 75.75 target area on the daily chart. Next extension up at 77.35 to 77.80. Bears need CL back under 76.20 to have anything to work with.

Dollar Index
Another bad day in DX but the CCI is pretty deep into oversold territory and price is down to a very extended extension target. I know it is common to think DX is done for but If we are close to an equity reversal that could run for a year or more, there is plenty of time for a deep retrace up at a minimum if not a new high.

Euro
Euro up as you would expect with DX down. Aggressive traders may try to see if they can get a fade started against 1.1280 to 1.1291. The more cautious can look for a drop back under 1.1202 before starting to look for a fade.


Gold
GC is slowing down in its bounce though I do prefer it try for just a bit higher to test at least 1972.90 before gravity takes back over.

