


The Week Ahead: 2022-10-02
Do equities collapse in October or setup for a bounce?
Bonds
I think we are pretty close to the first impulse down from the high in 2020. Below are weekly and monthly charts outlining that idea. On a technical note, I raised the degree labels by one from my previous charts.
I wouldn’t mind an attempt to get a little closer to the 119^28 target which is just under the 2018 low which is being tested right now. Does this mean I think the Fed is ready to cave and start lowering interest rates? No, just that the long end has largely factored in the rises this year and that we may finally see a return to an inverse relationship between bonds and equities.

On the weekly chart, the cycle that is the strongest is the ~70-week cycle that is starting to turn up into March of next year. Also of interest is the Wave 59 9-5 exhaustion study which is just one candle short of an ideal signal. I should also point out that the same study on the monthly chart above is late in its cycle.

Crude Oil
I’ve been hinting at my thinking has been changing to some degree about crude oil over the last week. I’ve come to the conclusion that the form thus far can work as an initial impulse down and due for a wave ii bounce before working lower next year to complete the wave [ii] retrace.

Dollar Index
DX is certainly a little overdone. I’ve seen some talk of the high being here and I concur that it needs a retrace though I’m open to higher next year. First a monthly chart for perspective.

So far, there hasn't been much of a pause that can really be called a fourth wave. I think we should see a wave four that doesn't require an electron microscope to see. Also, if there is a serious credit shock, I still think USD will be bid as the least bad option in a flight to safety trade. Yes, no doubt that has already been taking place but don’t see a good reason why it doesn’t continue after a pause.

Euro
Euro is trying to wake up after testing support at 0.9605. I grant that this is extremely difficult to count and freely admit that I could be wrong. However, it helps that the Wave 59 9-5 study has an exhaustion signal on this candle. It is possible that there would be a retest or new low while under 0.9958 but over it probably means a larger correction is getting started. Not sure what the pattern for a [iv] will take but a triangle would be a common form.

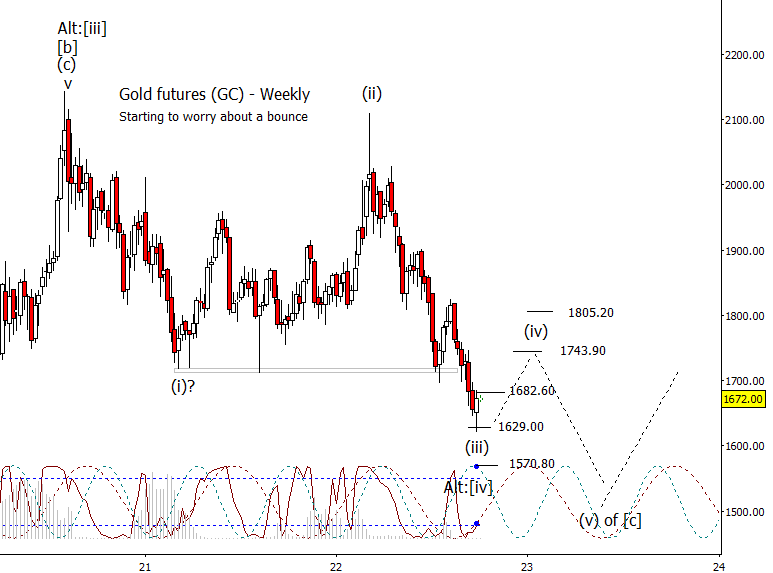
Gold
Gold is the chart that I’m the least happy with. I have mentioned before that the gold miners have a pattern that makes more sense to me, but I just have to work with what we have. I’m working on the hypothesis that gold is working on an ugly ending diagonal [c] that could use a bounce in (iv), especially if DX bounces. The alternative is this is a wave [iv] low.
Equities
How about we step back to get a big picture view with a monthly chart. I think SPX has a date with the 3268 to 3044 range at the very minimum, the question is when? Given that the top of that range is only ~300 points away, it is conceivable that it is tested this year, maybe even this month if panic sets in. However, considering how oversold the market is in lower time frames, I’m not confident in lower prior to a non-trivial bounce.

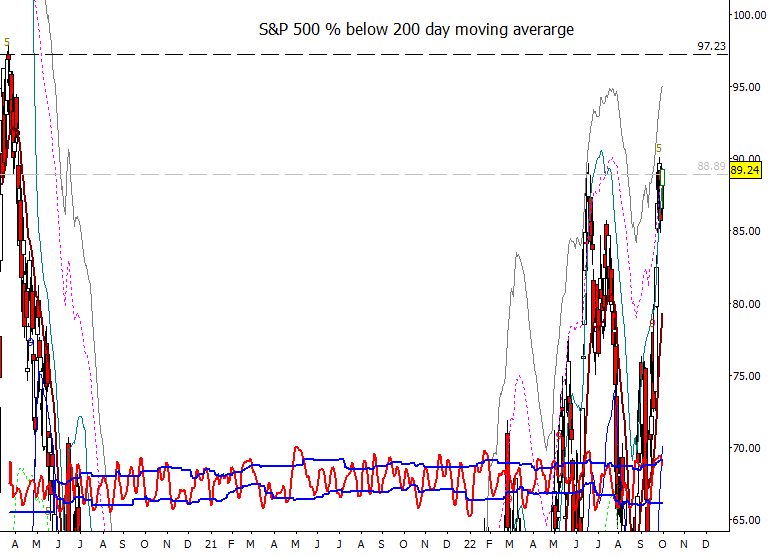
While I expect lower into next year, the following chart of the % of issues below the 200-day moving average in the S&P 100 gives me pause and wonder if we don’t get a bit of a rally to throw some bears off first. Note how we are just under the range of the pandemic high on this chart (low in prices).

And yes, before you ask, here is the same chart but for the S&P 500. Same basic story as you would expect. I backed the chart up so you can see more. You can argue that it has more room to run up but again, I wonder if they don’t shake some people off first.
Something else I’ve been thinking about this weekend is this Apple weekly chart. The cycle here has been pretty good this year and is forecasting a low now. Sure, it can overshoot but another reason to not be overly bearish at this point in time. I suppose a bearish interpretation would be that instead of running low to high in the next inflection, that it runs low to low. Next inflection is projected to be at the end of November. BTW, any bounce need not be as extreme as I depicted on the following chart.

Same relative story in Microsoft except it is weaker as it is under the June low. Maybe a bit lower over this week or next to tap 227.60 or 221.90.

Well getting back to the SPX weekly chart, SPX nearly tested next support at 3550 at the close last week. We will have to see if there is an acceleration now that the June low has been exceeded but as you can see from the above charts, I’m worried about this turning into a bear trap. Cycles on this chart are not terribly helpful as one is ready to rise into November while the other falls into it.

Bitcoin Futures
BTC futures did poke a tiny new low under the July low, but it would look better with a tap of 16180 before going into a lower degree fourth. Probably pretty late to try to fade BTC but not sure it is a buy yet.
