


The Week Ahead: 2024-02-25
Can the equity indices make another new high early in the week?
Bonds
I’m a little worried about wave ‘(b)’ being complete as we are getting pretty close to the next major cycle inflection point. The turn window is probably between now and late March. If the current bounce exceeds 121^23, I probably have to give up on a deeper ‘(b)’ wave.

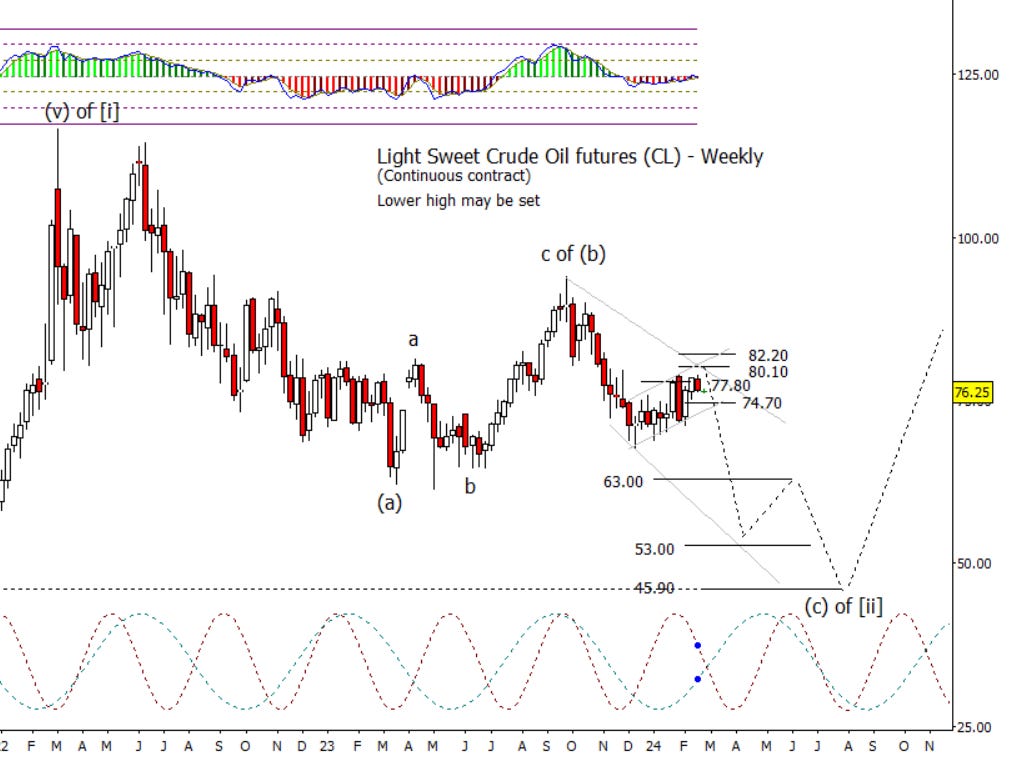
Crude Oil
The adaptive CCI, the indicator at the top of the chart, certainly has the look of being ready to turn back deeply into the red. Possible that the virtual double top last week set the lower high in crude oil.
Dollar Index
For the last several weeks, I have been talking about a minor retrace is possible in DX before moving higher. Imagine DX remains listless till the next equity correction kicks in.

Euro
The Euro appears to be in a small bounce to retest the 20 period EMA from underneath.

Gold
Gold is still bouncing from the test of support at 2012.90. The next cycle inflection is mid-March.

S&P 500
I know I am beating a dead horse when I say this, but we should be very late in the rise from the October low. That said, it could certainly extend a bit more. I think we are just waiting for the snowflake that starts the avalanche.

Russell 2000 Futures
The RTY was down slightly while the major indices were higher last week. If/when the RTY drops under 1992, I think a cascade lower can get started.

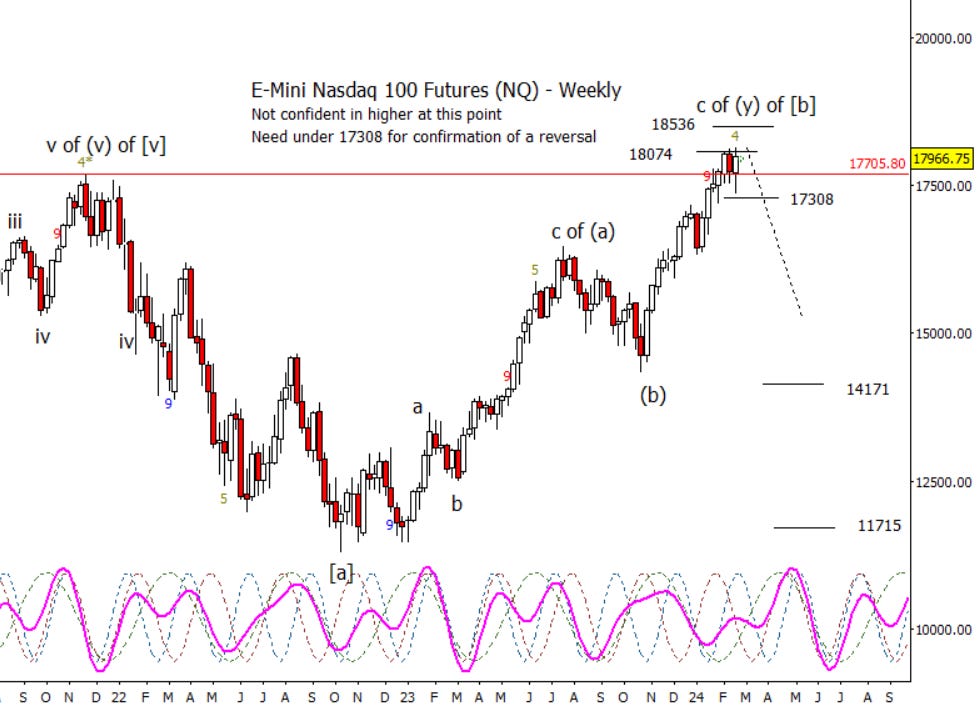
Nasdaq 100 Futures
The minor new high last week in NQ had the Wave 59 9-5 post at gold 4, just one short of an exhaustion signal. It is not clear on lower time frames that the advance from the low last week is complete so I’m open to a new high early this week but as I repeatedly say, it is very late in the form up from the October low.
Dow Industrials
As to form, everything I’ve said about the S&P 500 applies here. What I find interesting on this chart is the composite cycle did a good job of identifying the last swing low in January and is predicting a high this week.
