

The Week Ahead: 2024-03-10
The Week Ahead: 2024-03-10
CPI & PPI this week
Bonds
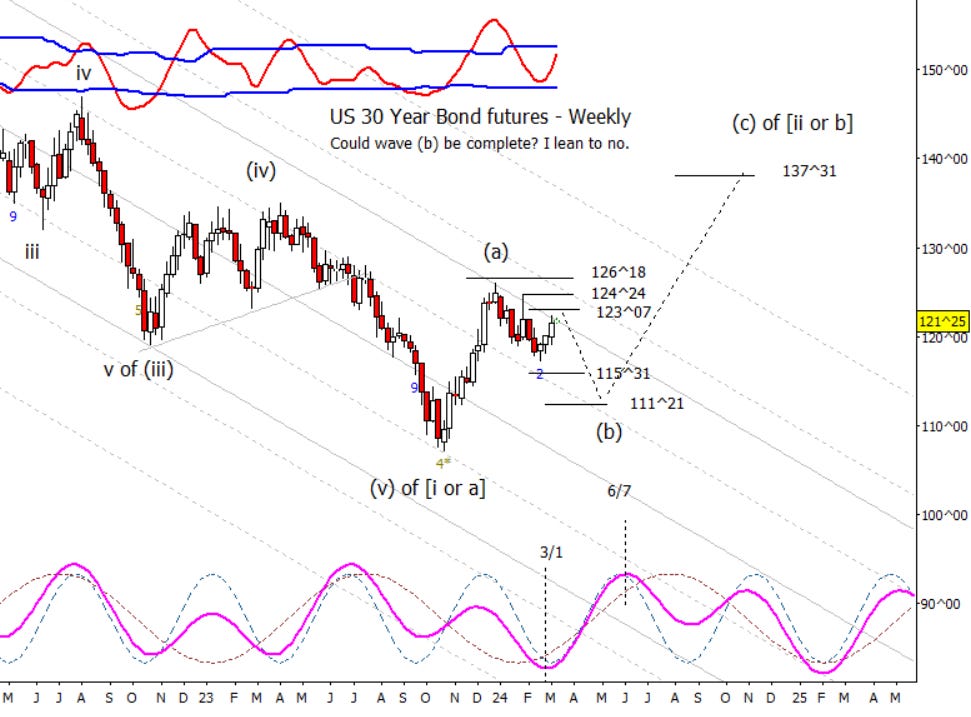
While I doubt that we have seen the (b) wave low, ZB may be still be working on ‘b of (b)’ instead of the count that I have been using which puts the ‘b of (b)’ at the high from about a month ago. Between the economic data this week and the FOMC meeting next week, I like a lower high forming soon.
Crude Oil
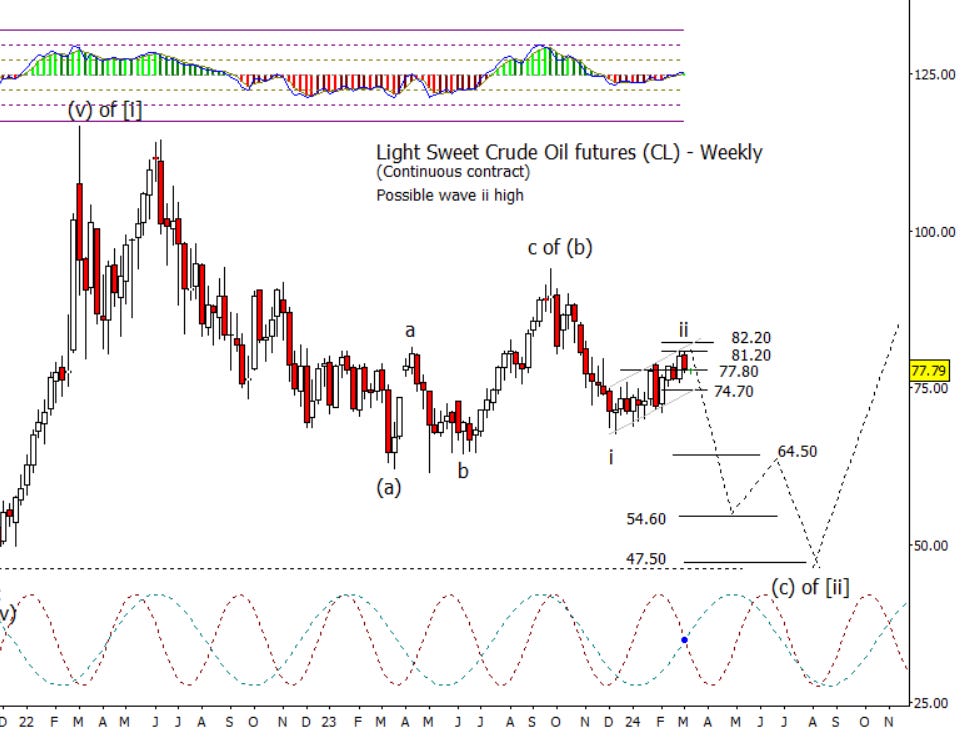
CL fell back away from 81.20 last week. Possible that the wave ii high is set but it would be better if crude can spend time under 77.80 this week and perhaps break under 74.70 next week.
Dollar Index
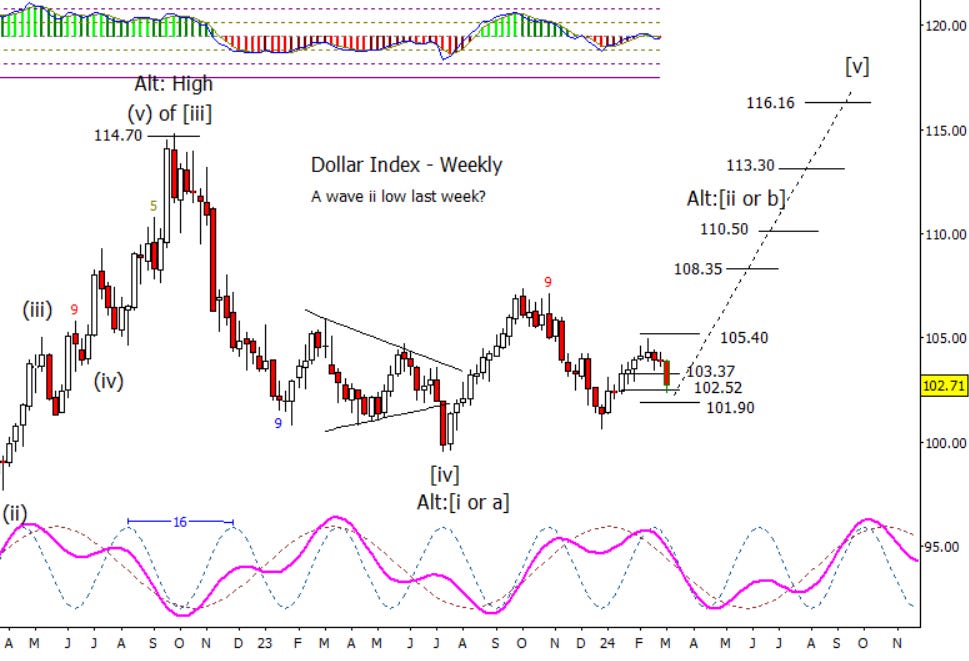
DX was under pressure last week as it fell under 103.37 to test the top of deep retrace territory at 102.52.
Euro
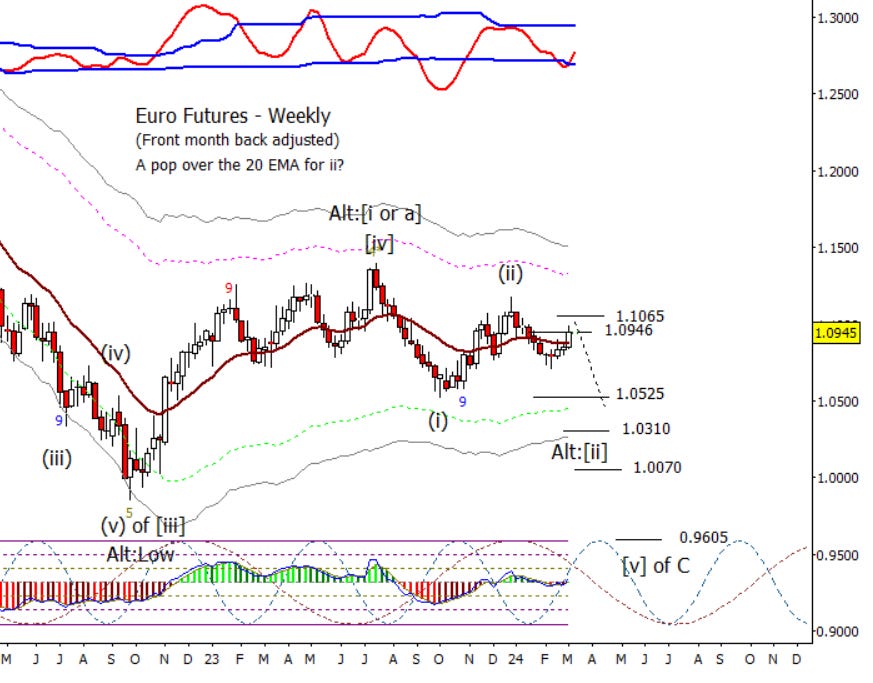
Same idea in Euro as above but in reverse. I lean to last week being the majority of ‘[C] of ii’.
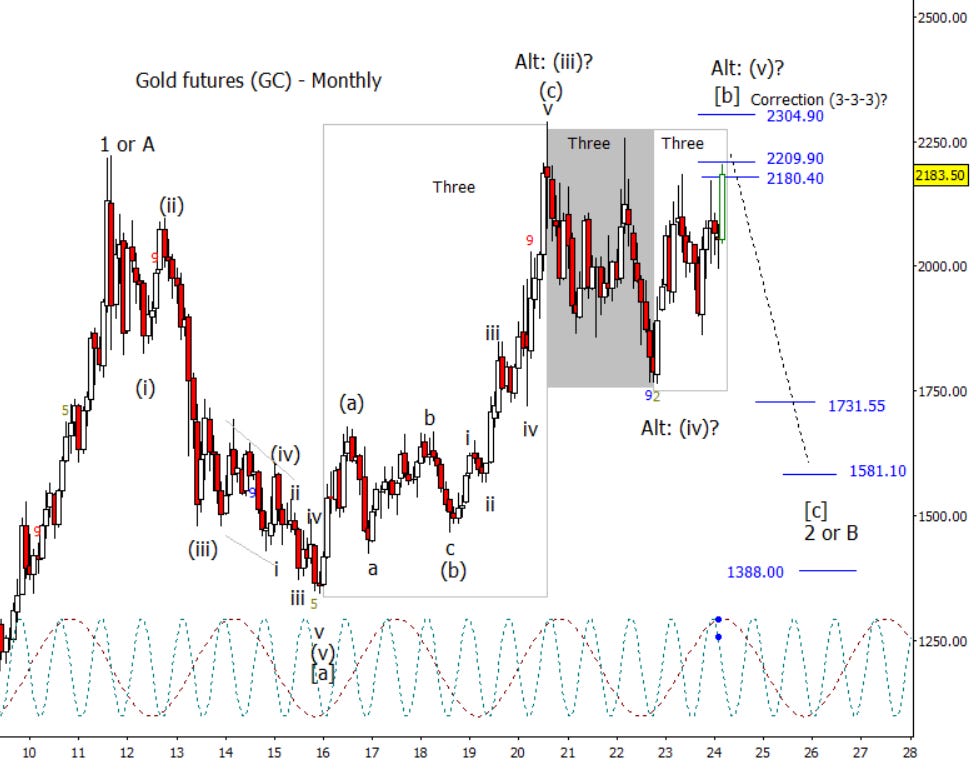
Gold
I’m backing up to a monthly chart on gold to make the point that the form is garbage. I know many are talking about a breakout but I’m skeptical. No, I can’t rule out a high over that of 2020 but this looks more like the end of something than a start. If the cycles on this chart are active, gold could be due for 12-18 months decline, not a surge that many are expecting. Yes, I know, in the very big picture, gold will rise as fiat is inflated away, but there will be swings in that move. Gold bugs will have their day in the sun, I just don’t think it is now.
S&P 500
A doji candle in SPX last week as it hugs the 5132 target. I can’t rule out a try to tap 5224 over the next week or two, but my confidence in higher is waning fast. I’ve done my best to stay open to higher targets but I think the ice is getting very thin.
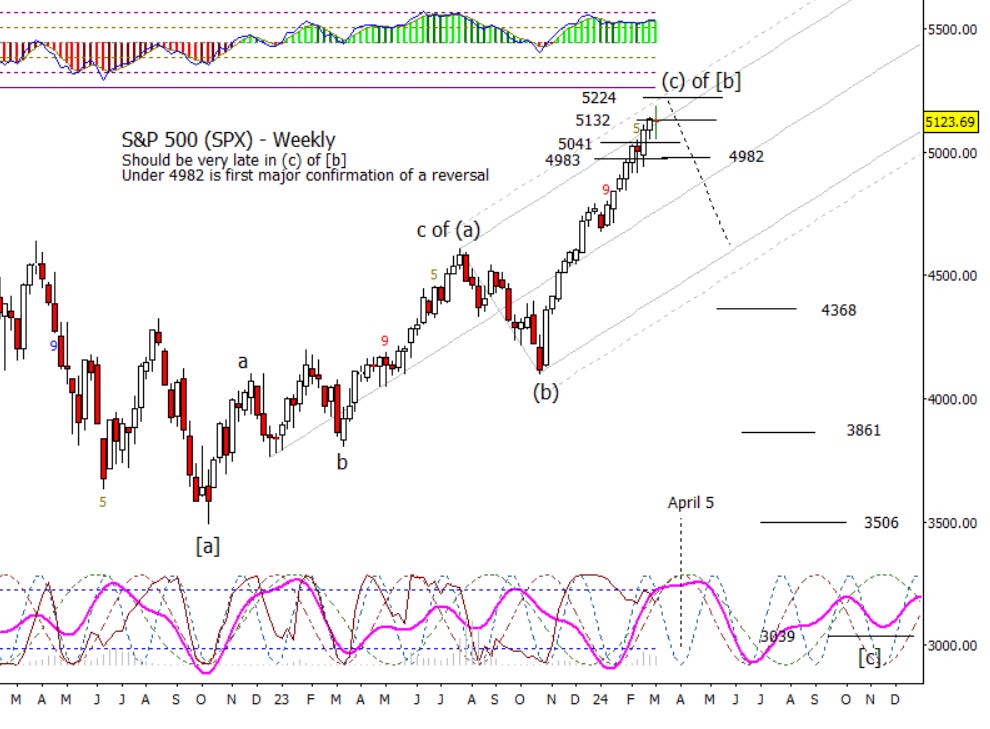
A subscriber asked me what I thought of this count in the comments, and I wanted to bring it to your attention as I do think it has some merit. I’m using this as the alternate if I’m wrong about the current high being a developing [b] wave. In this scenario, the current high in progress is wave three in an ending diagonal. I’ll be keeping an eye on this possibility in late third quarter of this year. We will have to see what kind of decline we have once the market rolls over.
