

Volatility ahead in commodities
Volatility ahead in commodities
Crude oil and gold are likely to put in strong moves during the next several weeks. Although each market is in a different phase of its pattern, we believe both commodities are reaching for durable lows to occur around mid-summer. Having a map of the terrain can keep a trader from making a costly misstep.
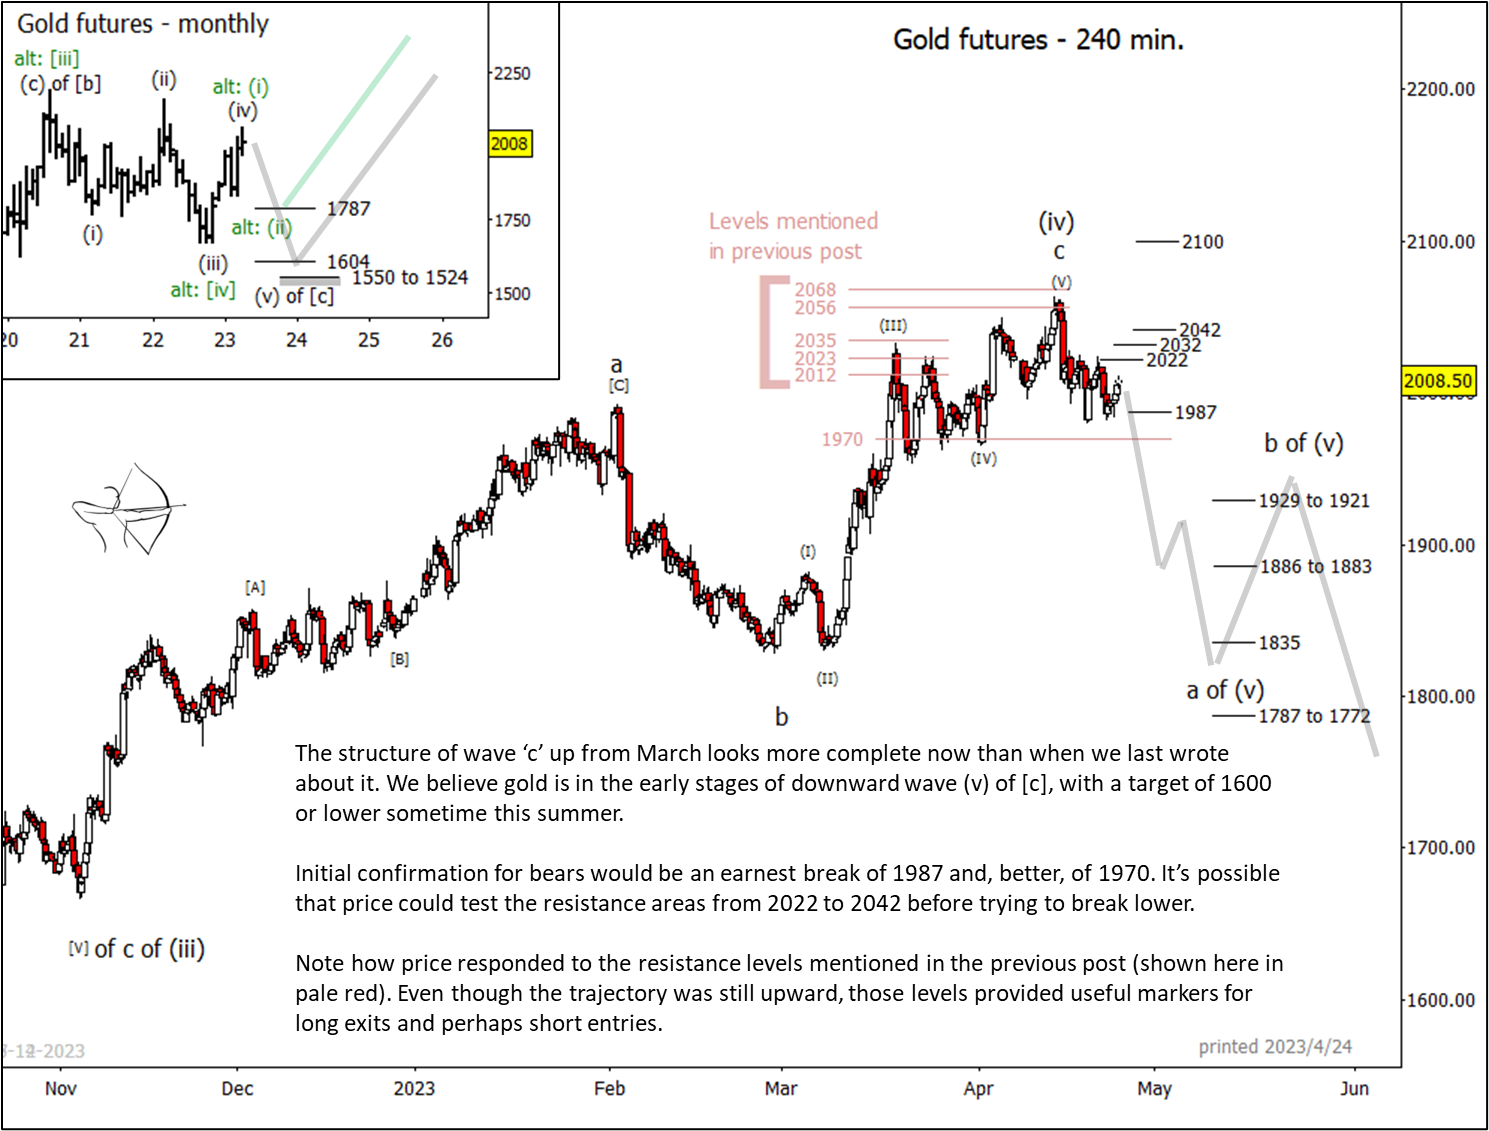
Gold climbed considerably higher than we were expecting when we wrote about it on March 21, but the structure of the upward wave 'c' of (iv) looks well defined now. It's possible a reversal has already begun, and a break of supports at 1,987 and 1,970 would serve as initial confirmation for bears.
A failure of support at 1,970 should provoke a fairly rapid descent in wave 'a' of (v) to the middle area of supports near 1,886, 1,835, and 1,787. From there, traders should be alert to the possibility of a substantial bounce in wave 'b'. There's also a contingency scenario where that bounce could continue upward, as shown with the alternative scenario drawn in green. In either case, the market will set up a situation that will catch many traders off guard.
The larger pattern that began in 2020 would look better with a new low, and we have preliminary target support zones for wave 'c' of (v) of [c] of 'II' near 1,604 and 1,550. Elliott wave traders know a wave 'II' low precedes a strong wave 'III' rally. The pattern we're labelling as a second wave has stayed within a range for three years, and a third wave should take price considerably out of that range.
In the very near term, we can't rule out a modest rise this week to test resistance levels from 2022 to 2042 as marked on the chart. If price exceeds the mid-April high then 2,100 becomes a viable target for risk-tolerant bulls.
While we expect gold to start trending downward, crude oil is likely to become quite volatile during the next few weeks while also staying within a range. This environment will favour nimble intraday traders who aren't averse to taking profits quickly.
The gap fill we suggested two weeks ago appears almost complete. After that, we would like to see price remain beneath the resistance levels marked from 88.60 to 88.10, but the lower side of the range is harder to specify. Price could wend a complicated path among the support zones before the currently developing wave [B] is finished, and the subsequent upward wave [C] wave might at first appear just to be part of the previous [B] wave structure. Wave [C] need not even make a new high.
To get a sense of the impending volatility, consider previous segments in the chart below that we have identified as [B] waves.
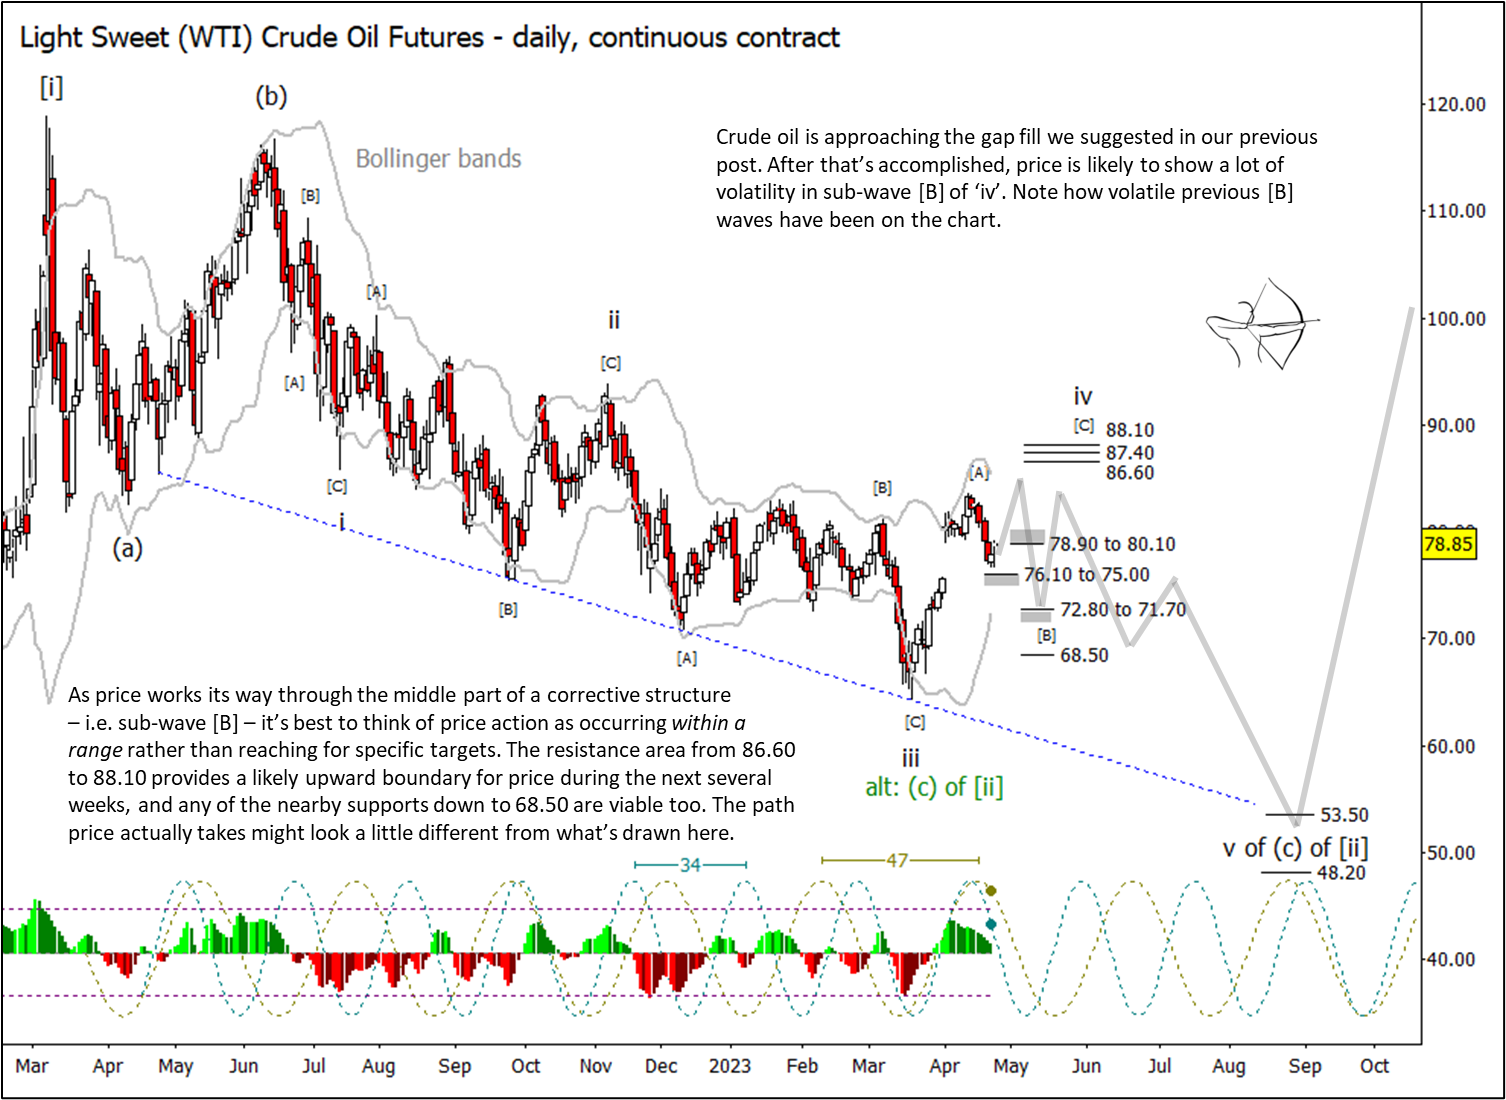
After a few weeks of volatile but sideways action, we expect crude oil to begin trending rapidly downward to meet a target zone that features 53.50 and 48.20 as possible supports. In our primary scenarios, price lows in both oil and gold should occur fairly close to each other in time.
Trading On The Mark uses technical analysis to identify the trends and turns in highly traded markets for commodities, energy, currency, bonds and indices. Consider subscribing to our daily or intraday services!